Copyright
©The Author(s) 2025.
World J Diabetes. May 15, 2025; 16(5): 103511
Published online May 15, 2025. doi: 10.4239/wjd.v16.i5.103511
Published online May 15, 2025. doi: 10.4239/wjd.v16.i5.103511
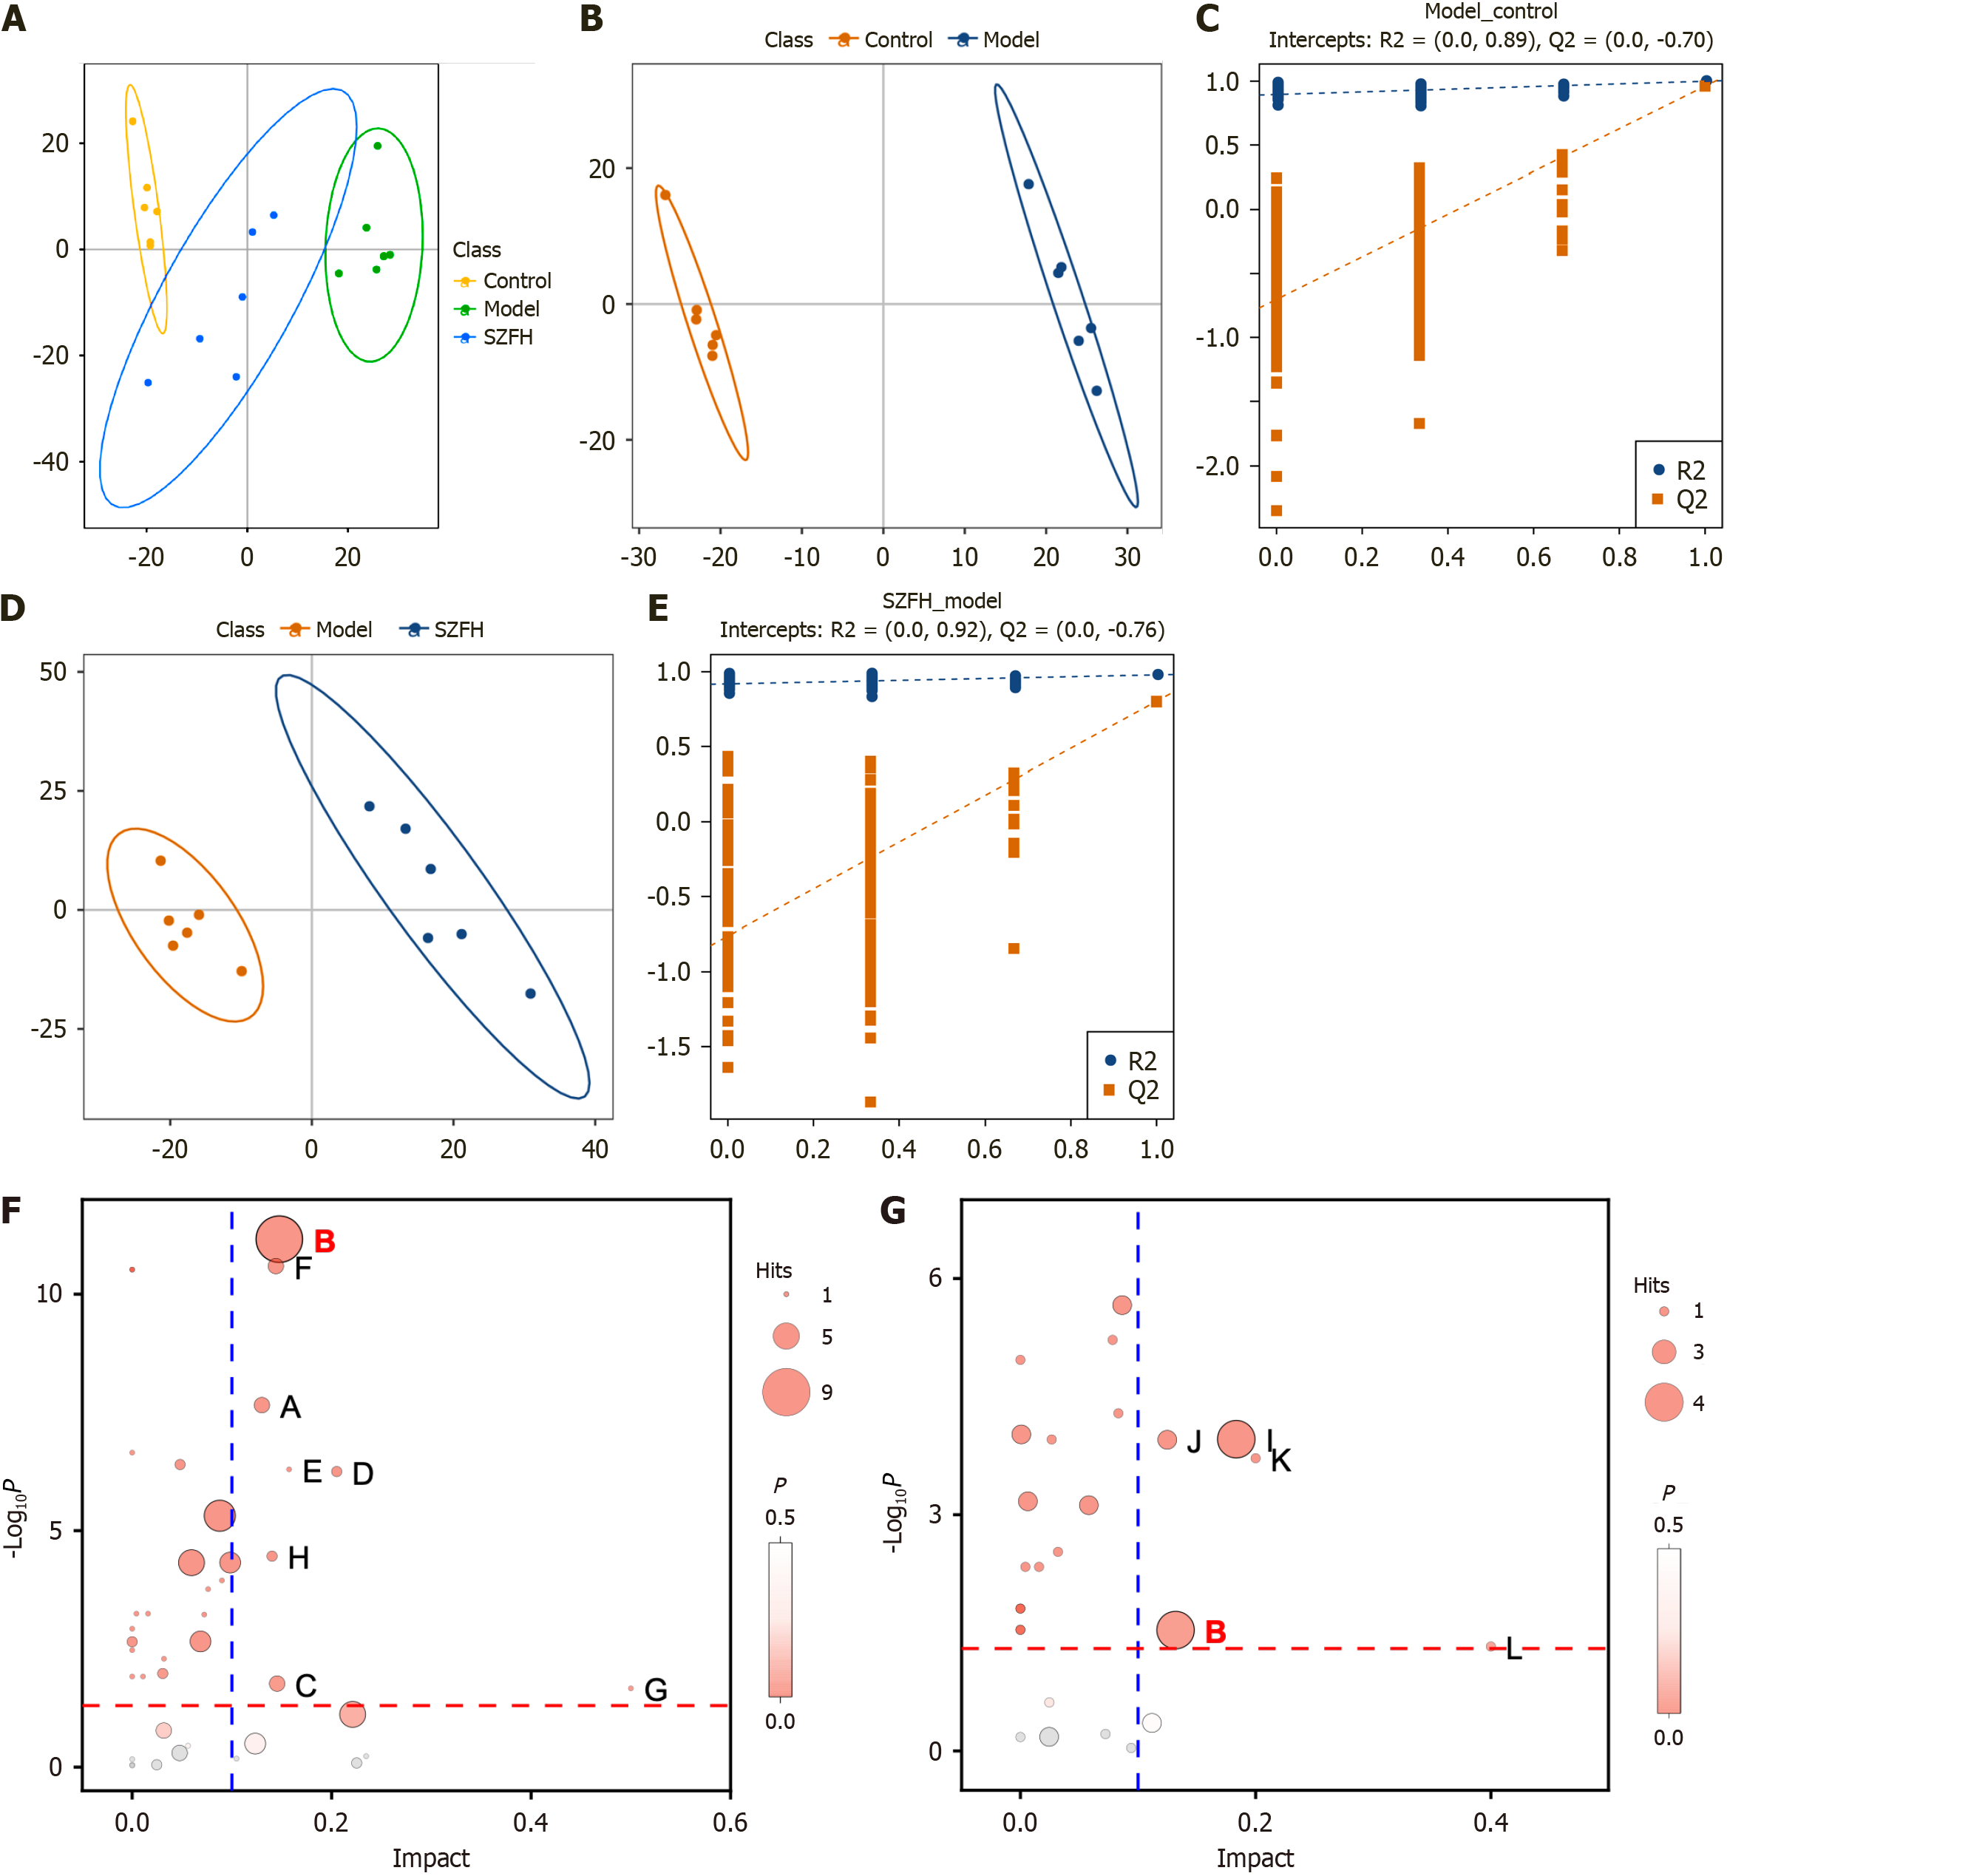
Figure 3 Non-targeted metabolomic results of renal tissues in diabetic nephropathy mice with Shenzhuo formulation intervention.
Non-targeted metabolomic analysis was performed on Control, model group (Model), and Shenzhuo formulation high dose group (SZFH). A: Principal component analysis results showing that the metabolite levels in renal tissues were significantly different among Control, Model, and SZFH groups; B-E: Results of the PLS-DA model and alignment test validation model showing that Model vs Control (B and D) and SZFH vs Model (C and E) exhibits good fit and predictive ability; F and G: KEGG pathway enrichment analysis of Model vs Control (F) and SZFH vs Model (G). Shared pathways between the two are marked in red. Amino sugar and nucleotide sugar metabolism, KEGG ID: 00520; Arachidonic acid metabolism, KEGG ID: 00590; Arginine and proline metabolism, KEGG ID: 00330; Cysteine and methionine metabolism, KEGG ID: 00270; Fructose and mannose metabolism, KEGG ID: 00051; Glycerophospholipid metabolism, KEGG ID: 00564; Riboflavin metabolism, KEGG ID: 00564; Sphingolipid metabolism, KEGG ID: 00600; Purine metabolism, KEGG ID: 00230; Pentose phosphate pathway, KEGG ID: 00030; Biotin metabolism, KEGG ID: 00780; Taurine and hypotaurine metabolism, KEGG ID: 00430. n = 6 per group. SZFH: Shenzhuo formulation high dose group; Control: Control group; Model: Model group.
- Citation: Zhang ZY, Wang YM, Wang N, Wang YS, Zhang H, Wang D, Wang LX, Cui HT, Wen WB, Lv SQ, Cao YJ. Shenzhuo formulation ameliorates diabetic nephropathy by regulating cytochrome P450-mediated arachidonic acid metabolism. World J Diabetes 2025; 16(5): 103511
- URL: https://www.wjgnet.com/1948-9358/full/v16/i5/103511.htm
- DOI: https://dx.doi.org/10.4239/wjd.v16.i5.103511


