Copyright
©The Author(s) 2025.
World J Diabetes. May 15, 2025; 16(5): 103511
Published online May 15, 2025. doi: 10.4239/wjd.v16.i5.103511
Published online May 15, 2025. doi: 10.4239/wjd.v16.i5.103511
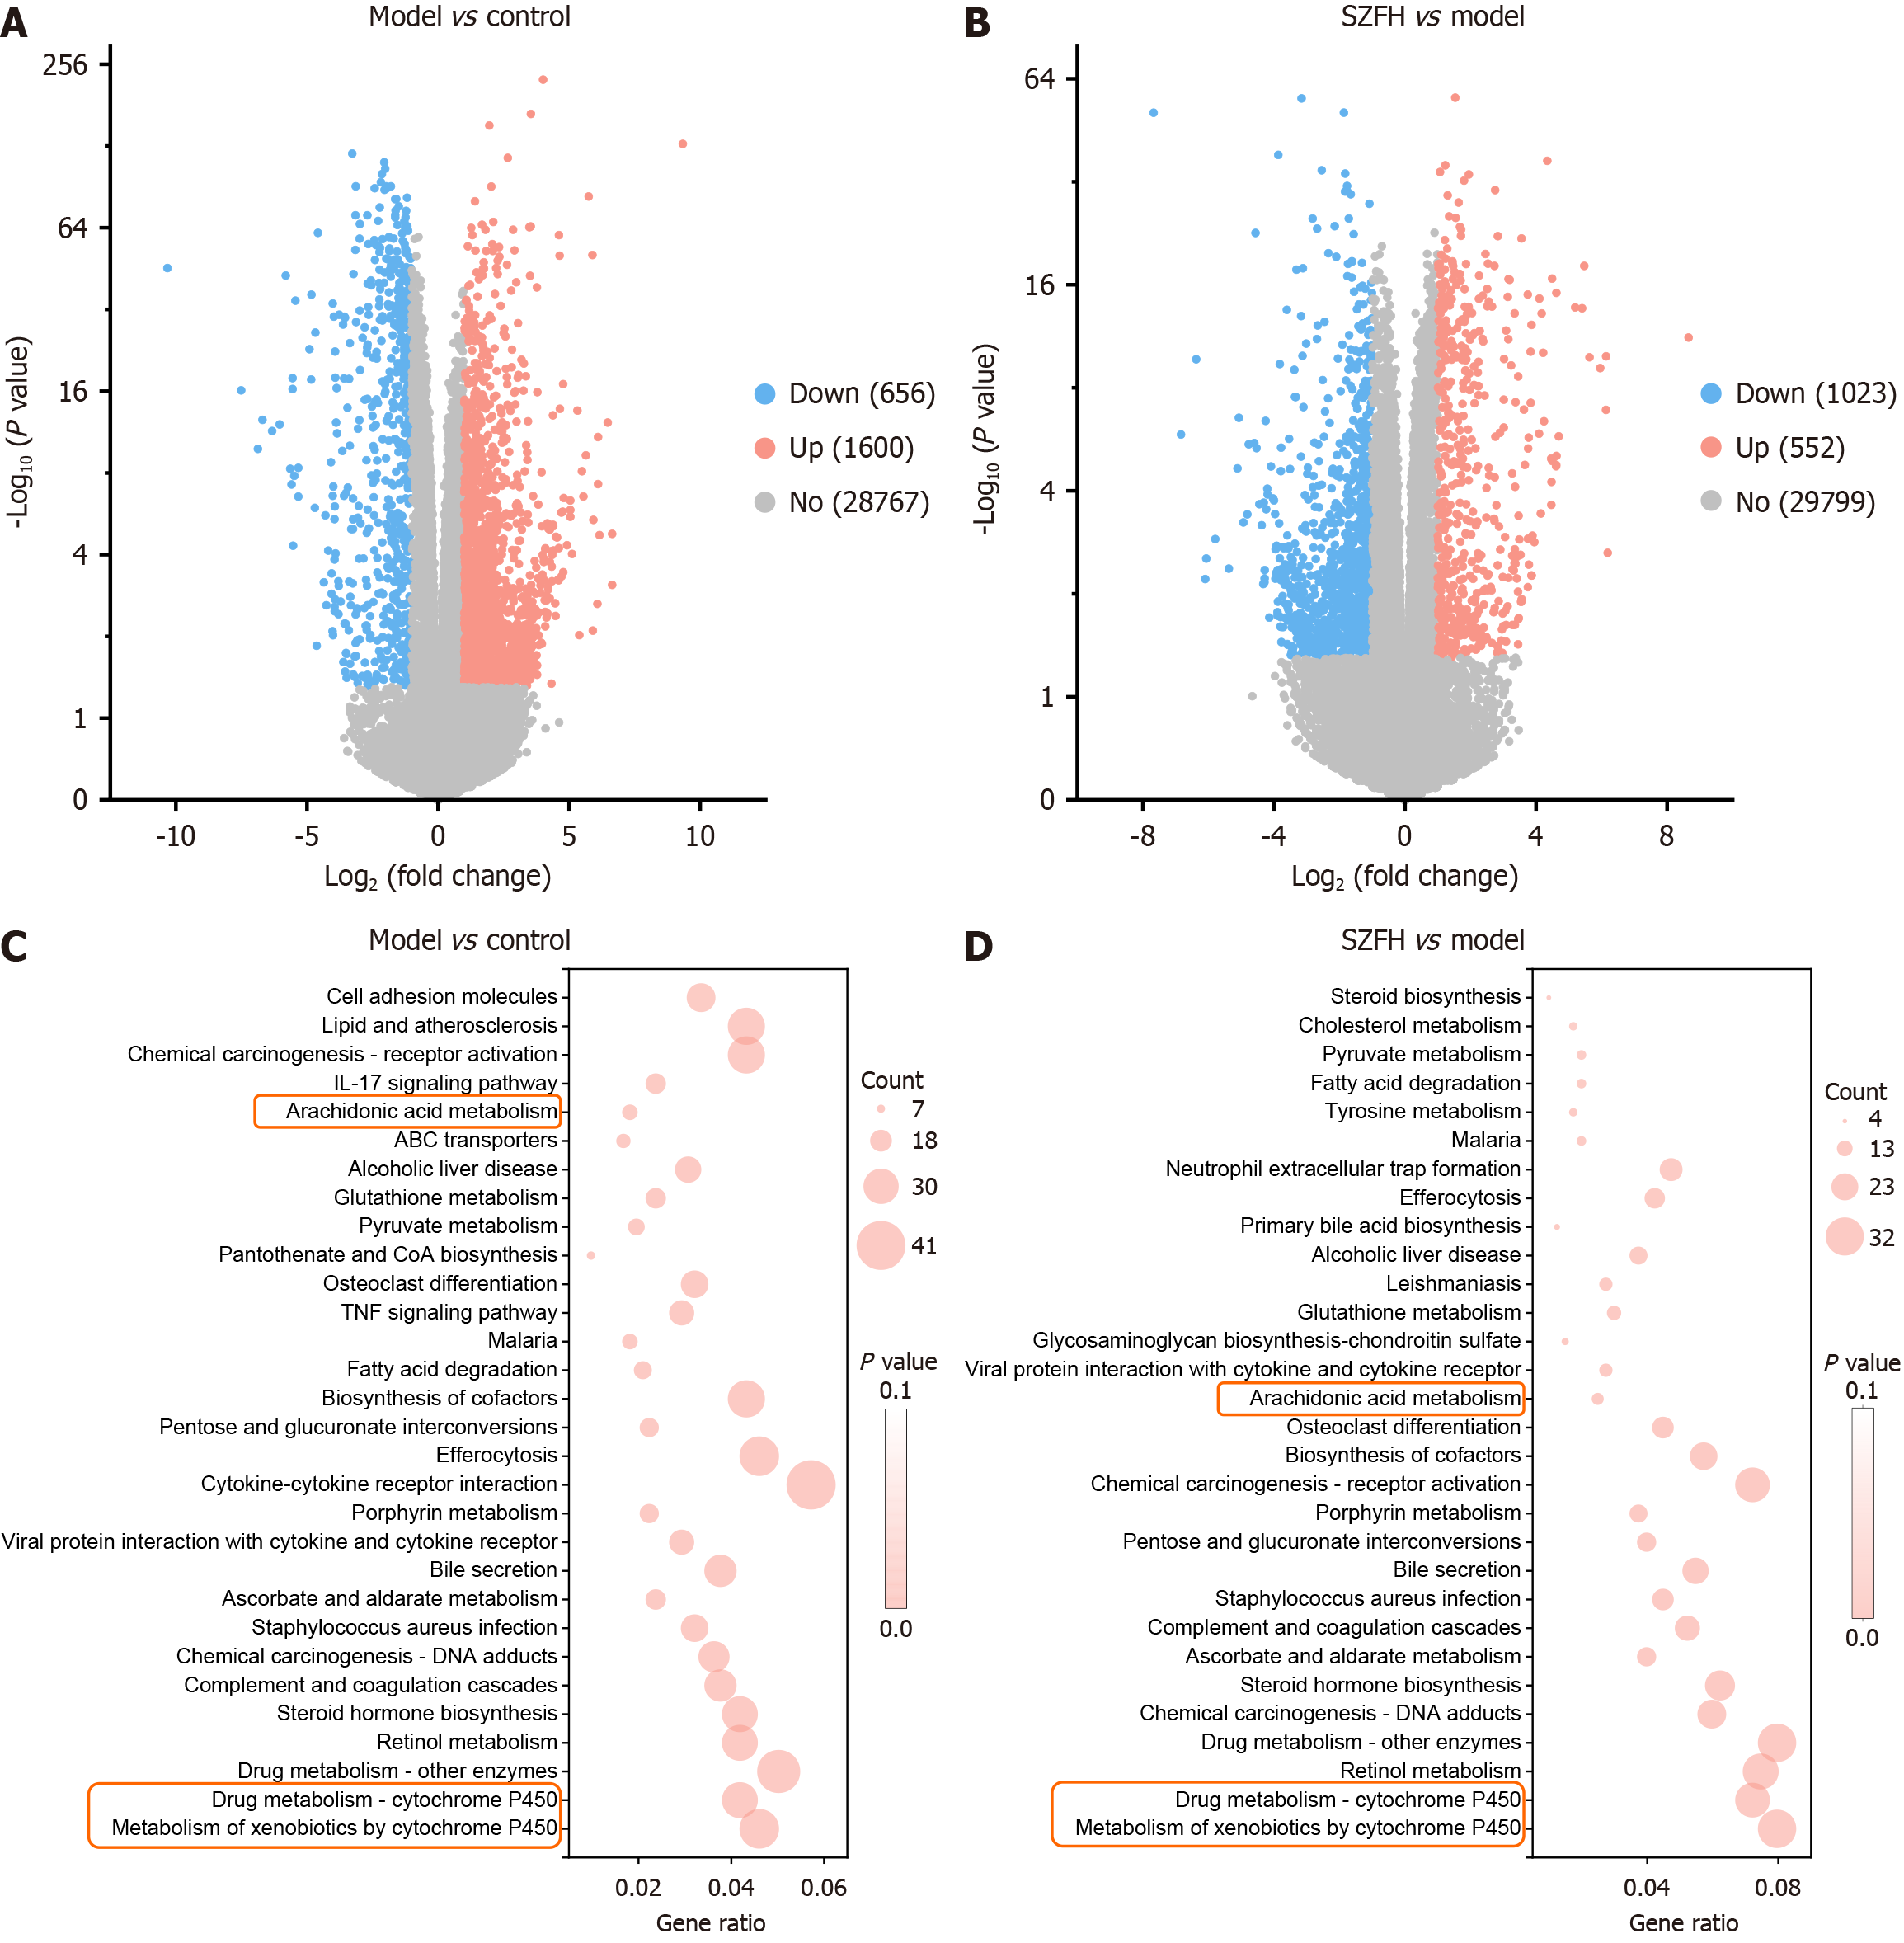
Figure 2 Transcriptomics results of model group vs control and Shenzhuo formulation high dose group vs model group in diabetic nephropathy mice.
We performed transcriptomic analysis for control, model group (Model), and Shenzhuo formulation high dose group (SZFH). DEGs of Model vs control and SZFH vs Model were screened by |Log2 (FoldChange)| ≥ 1, Padj ≤ 0.05, respectively. A and B: DEGs visualized using volcano plots; C and D: KEGG pathway enrichment analysis revealing that DEGs of Model vs control are mainly enriched in metabolism of xenobiotics by cytochrome P450 (CYP450), drug metabolism-CYP450, drug metabolism-other enzymes, etc. (C), and DEGs of SZFH vs Model are mainly enriched in CYP450, Drug metabolism-CYP450, retinol metabolism etc. (D). AA metabolism, metabolism of xenobiotics by CYP450, drug metabolism-CYP450 are the intersecting pathway. n = 3 per group. DEGs: Differentially expressed genes; Control: Control group; Model: Model group; SZFH: Shenzhuo formulation high dose group.
- Citation: Zhang ZY, Wang YM, Wang N, Wang YS, Zhang H, Wang D, Wang LX, Cui HT, Wen WB, Lv SQ, Cao YJ. Shenzhuo formulation ameliorates diabetic nephropathy by regulating cytochrome P450-mediated arachidonic acid metabolism. World J Diabetes 2025; 16(5): 103511
- URL: https://www.wjgnet.com/1948-9358/full/v16/i5/103511.htm
- DOI: https://dx.doi.org/10.4239/wjd.v16.i5.103511


