Copyright
©The Author(s) 2025.
World J Diabetes. May 15, 2025; 16(5): 102994
Published online May 15, 2025. doi: 10.4239/wjd.v16.i5.102994
Published online May 15, 2025. doi: 10.4239/wjd.v16.i5.102994
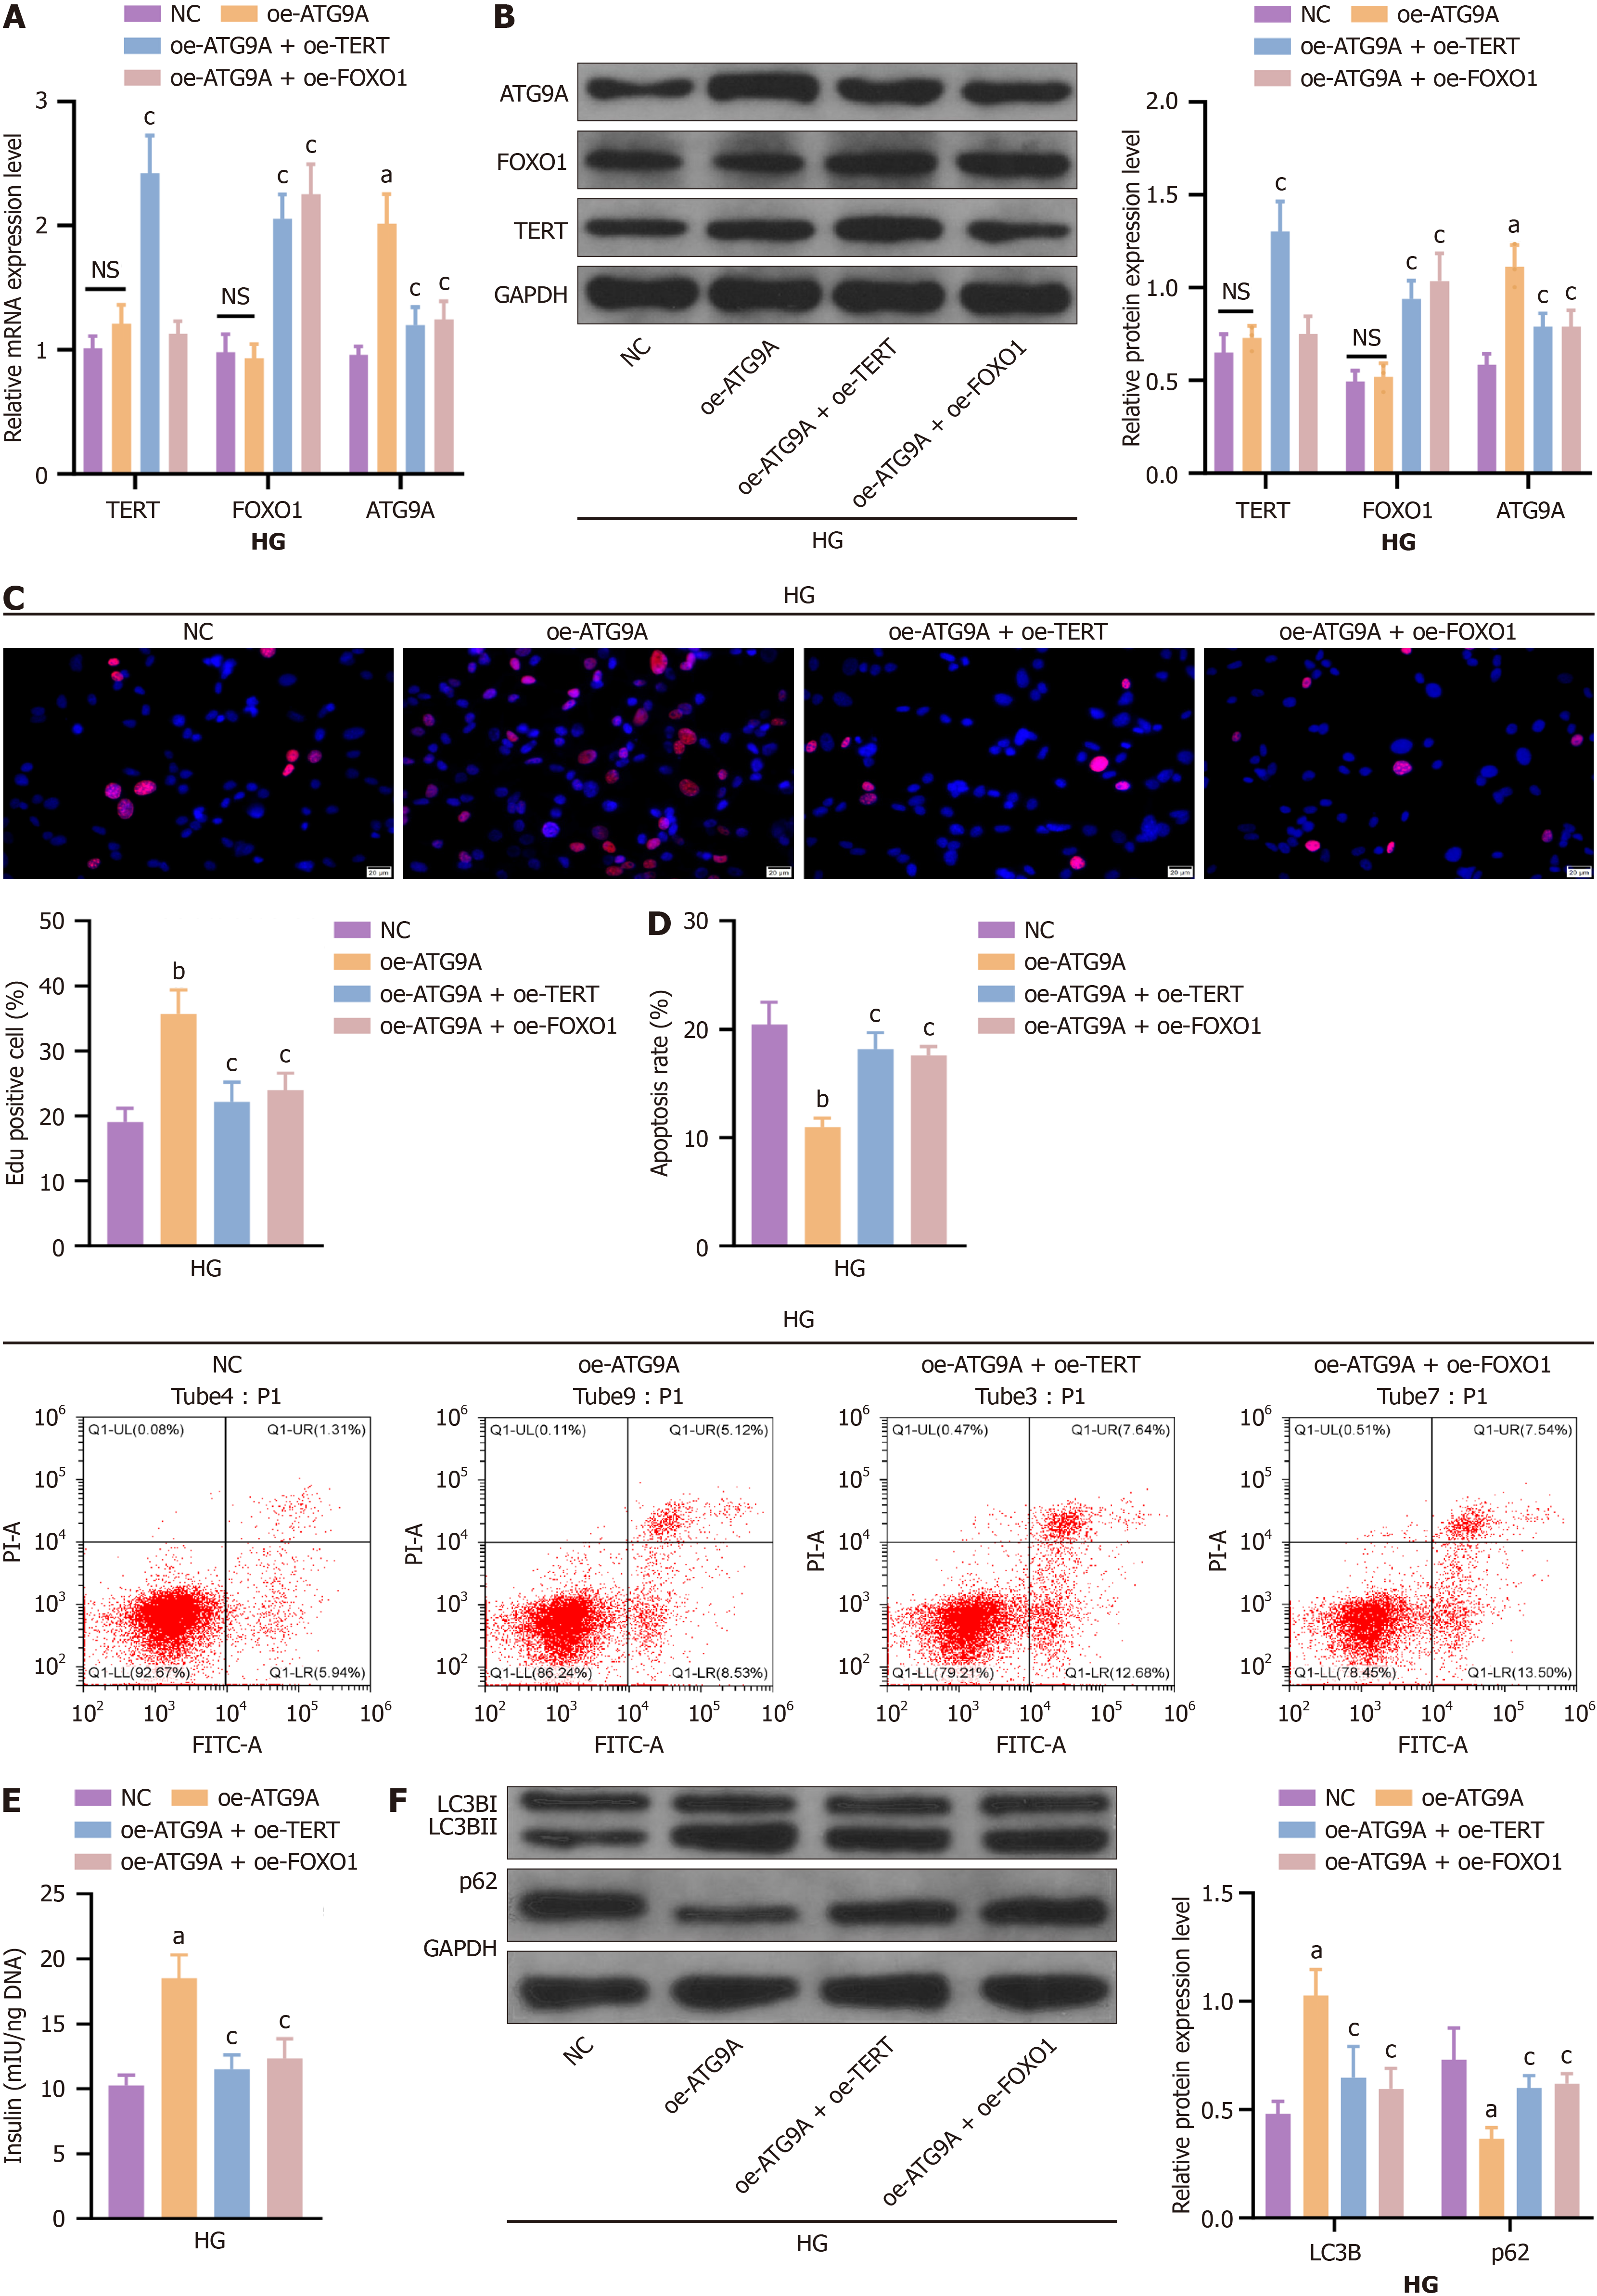
Figure 5 TERT/FOXO1 suppresses ATG9A-mediated autophagy to increase high glucose-induced islet β-cell dysfunction.
oe-ATG9A was transfected or cotransfected with oe-TERT and oe-FOXO1 into high glucose-treated MIN6 cells. A and B: Reverse transcription quantitative polymerase chain reaction and western blotting were used to analyze TERT, FOXO1 and ATG9A mRNA and protein expression; C: EdU staining was used to analyze cell proliferation ability (red staining: the labeled proliferating cells, blue staining: the nuclei); D: Flow cytometry was used to assess the cell apoptosis rate; E: Insulin levels were measured via ELISAs; F: The expression of the autophagy proteins LC3B and p62 was analyzed via western blotting. The data are expressed as mean ± SD. Each experiment was conducted in triplicate. aP < 0.05 vs NC group, bP < 0.05 vs NC group, cP < 0.05 vs the oe-ATG9A group. NS: No significance; HG: High glucose.
- Citation: Lei XT, Chen XF, Qiu S, Tang JY, Geng S, Yang GY, Wu QN. TERT/FOXO1 signaling promotes islet β-cell dysfunction in type 2 diabetes mellitus by regulating ATG9A-mediated autophagy. World J Diabetes 2025; 16(5): 102994
- URL: https://www.wjgnet.com/1948-9358/full/v16/i5/102994.htm
- DOI: https://dx.doi.org/10.4239/wjd.v16.i5.102994


