Copyright
©The Author(s) 2025.
World J Diabetes. May 15, 2025; 16(5): 101473
Published online May 15, 2025. doi: 10.4239/wjd.v16.i5.101473
Published online May 15, 2025. doi: 10.4239/wjd.v16.i5.101473
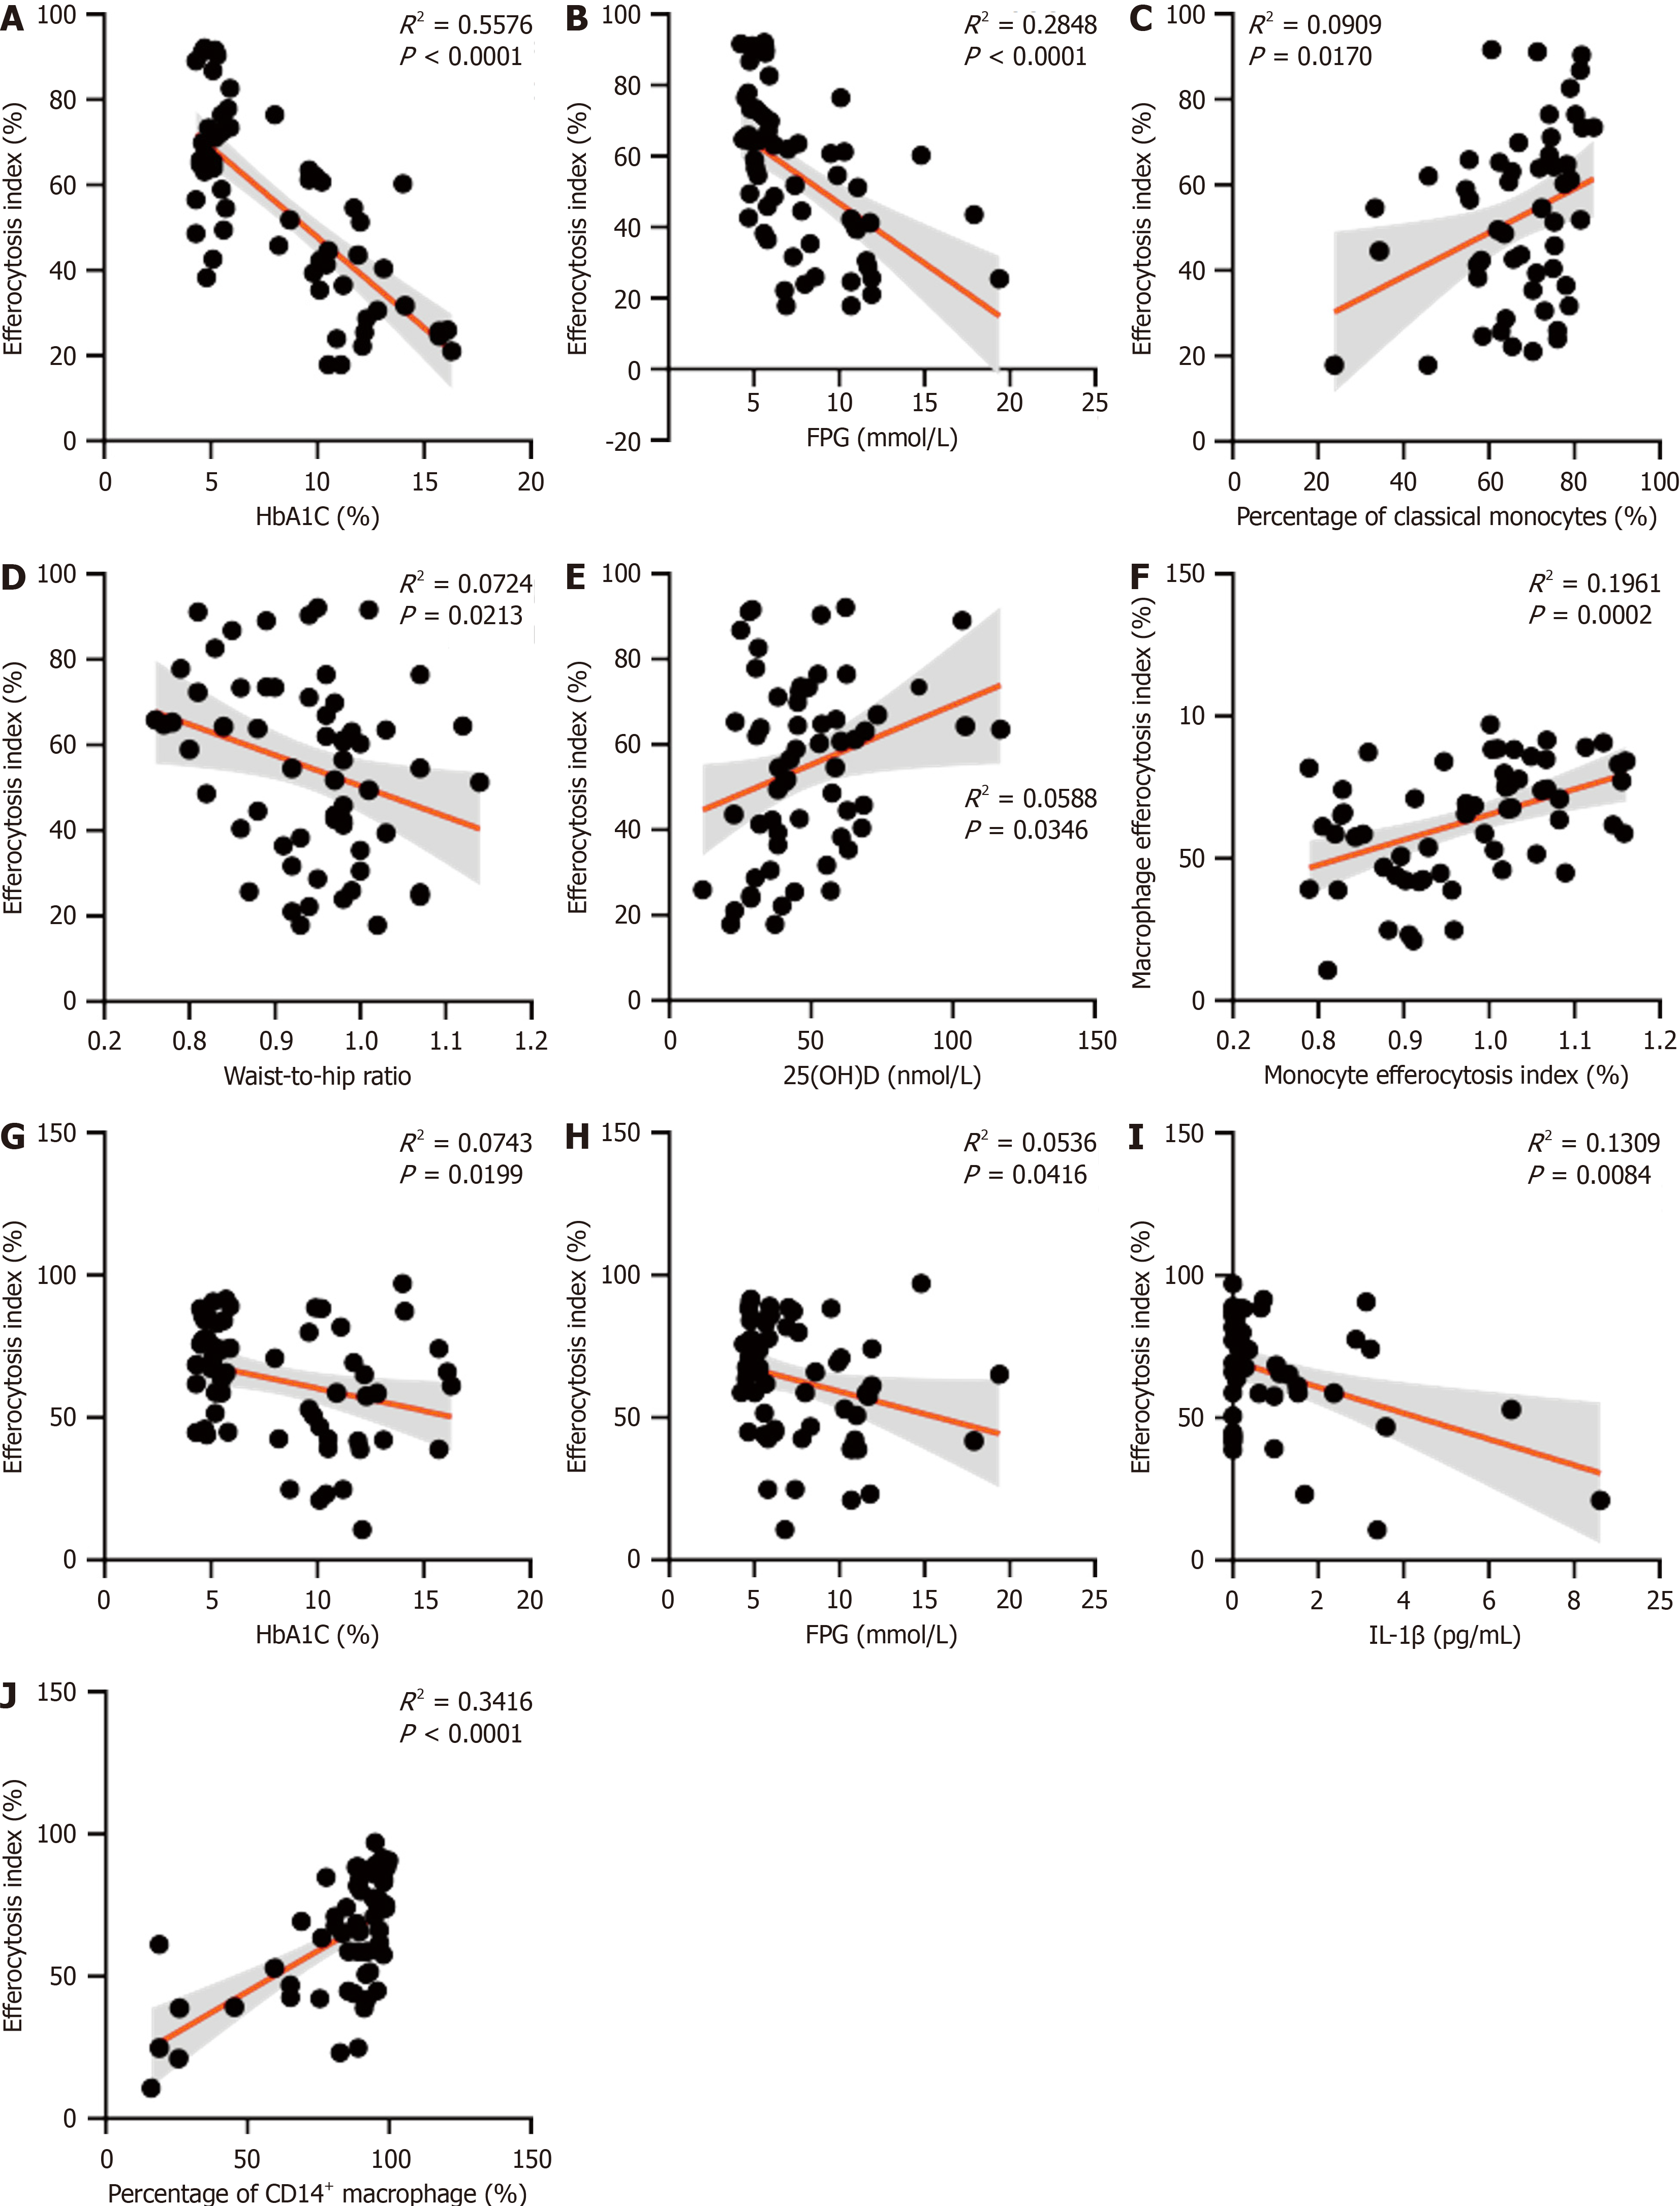
Figure 3 Parameters correlated with the efferocytosis index of monocytes and monocyte-derived macrophages in the total sample population.
A-E: Univariate regression analysis of the relationships between each variable and the efferocytosis indices of monocytes; F-J: Monocyte-derived macrophages in the total sample population. The regression line (black line) and corresponding 95%CI (gray area) are shown for each univariate regression analysis. FPG: Fasting plasma glucose.
- Citation: Mao QY, Ran H, Hu QY, He SY, Lu Y, Li H, Chai YM, Chu ZY, Qian X, Ding W, Niu YX, Zhang HM, Li XY, Su Q. Impaired efferocytosis by monocytes and monocyte-derived macrophages in patients with poorly controlled type 2 diabetes. World J Diabetes 2025; 16(5): 101473
- URL: https://www.wjgnet.com/1948-9358/full/v16/i5/101473.htm
- DOI: https://dx.doi.org/10.4239/wjd.v16.i5.101473


