Copyright
©The Author(s) 2025.
World J Diabetes. May 15, 2025; 16(5): 101447
Published online May 15, 2025. doi: 10.4239/wjd.v16.i5.101447
Published online May 15, 2025. doi: 10.4239/wjd.v16.i5.101447
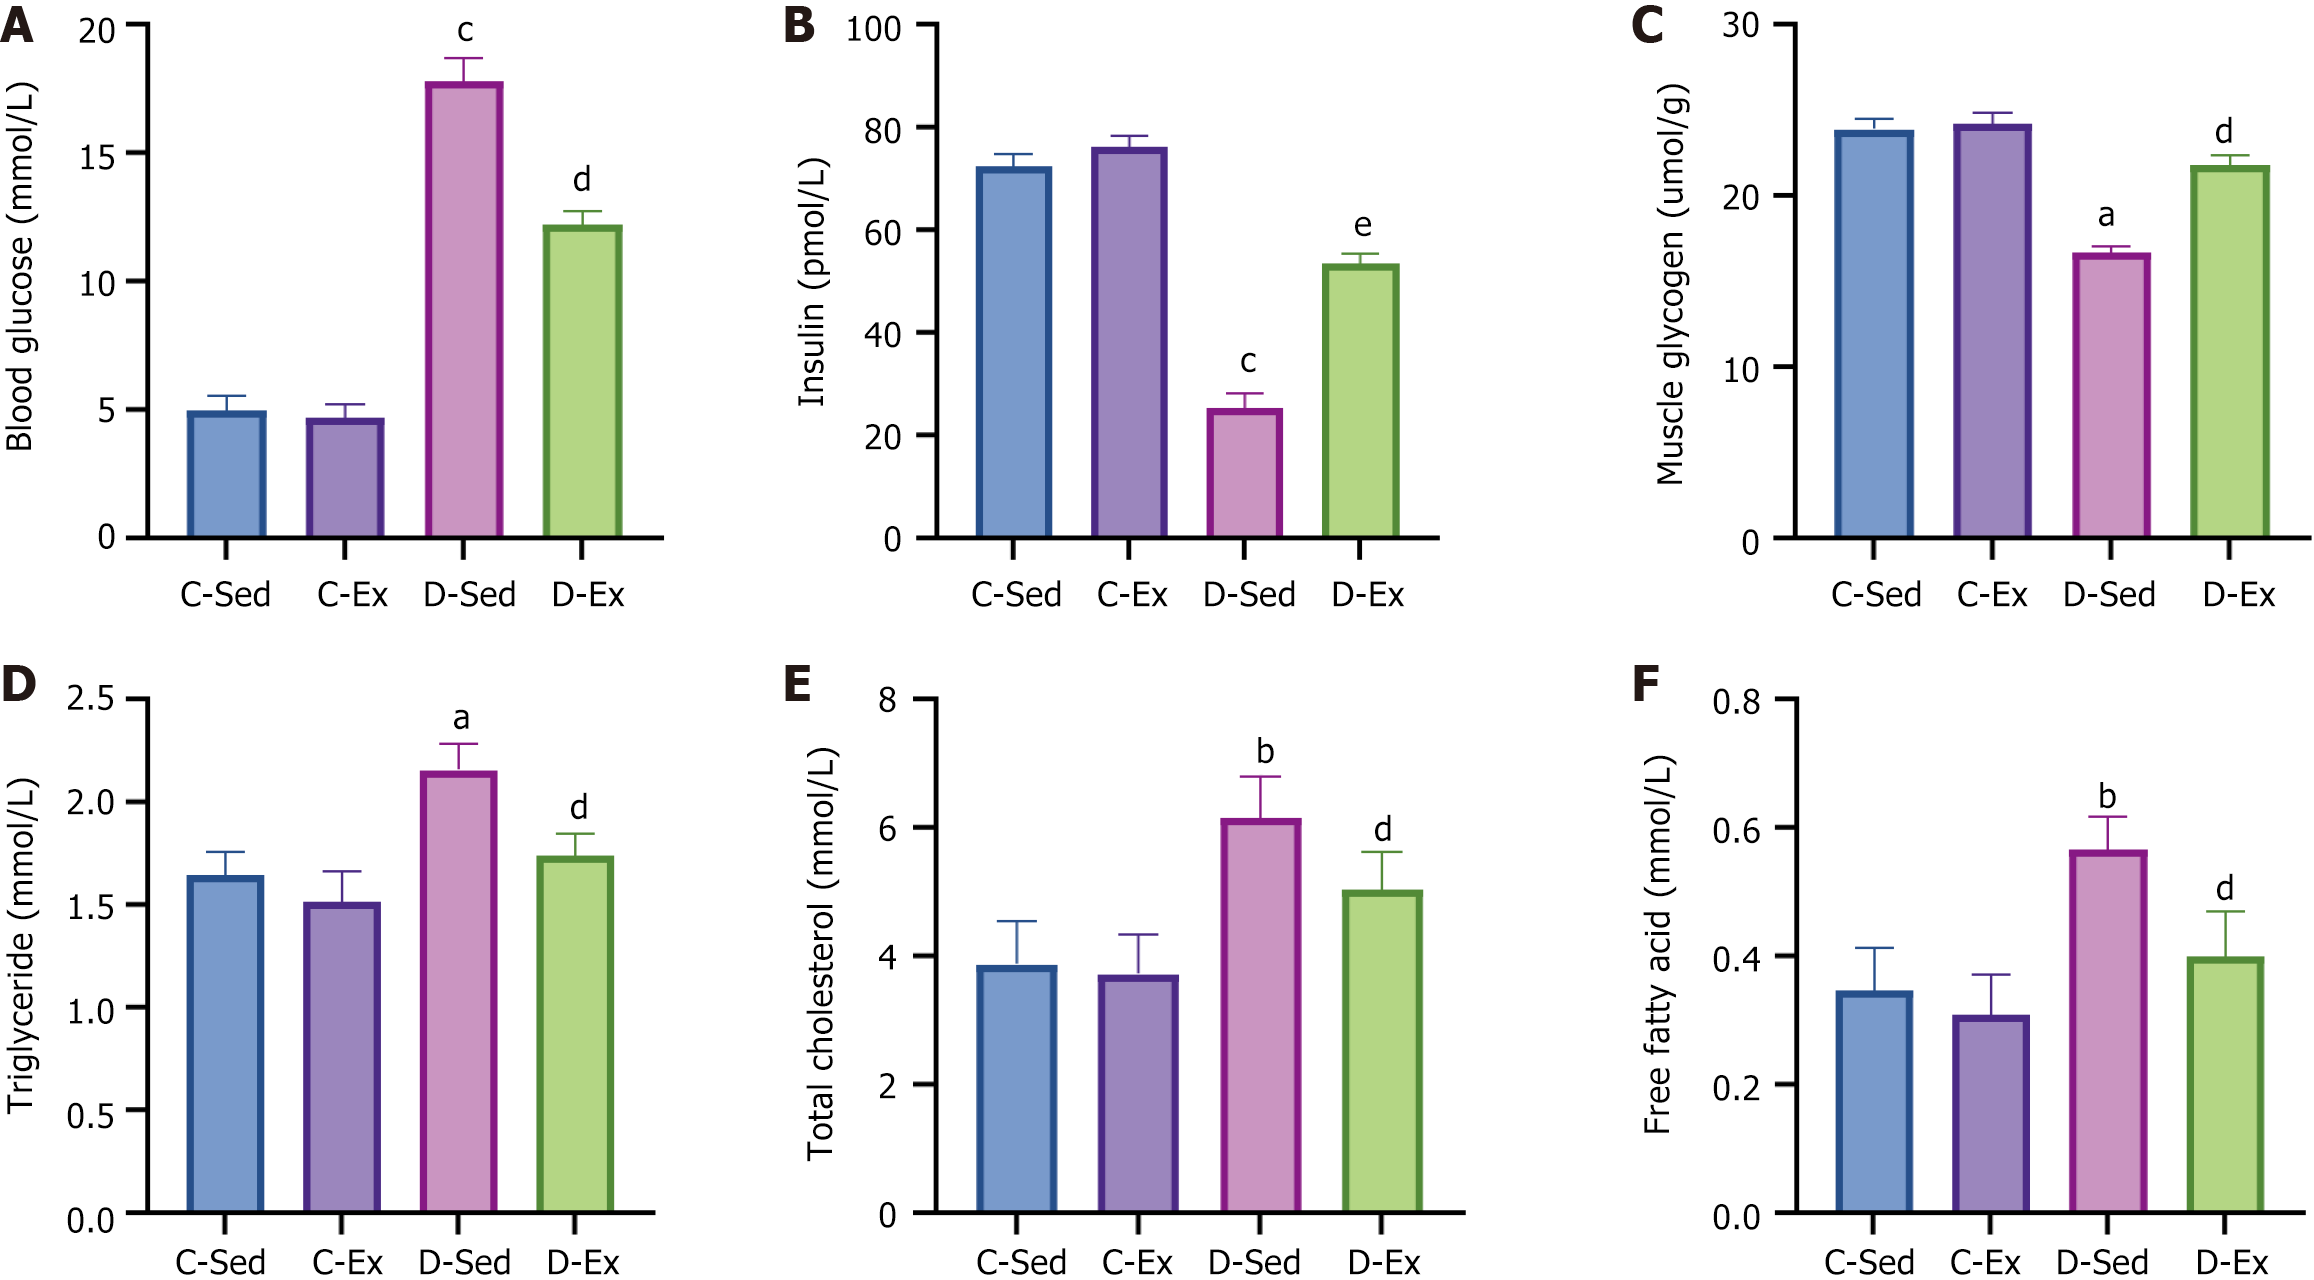
Figure 2 Serum biomarkers of rat model of diabetes and effect of exercise.
A: Measurement of blood glucose levels from blood collected via tail vein; B: Detection of insulin levels from blood collected via tail vein; C: Measurement of glycogen content from the gastrocnemius muscle; D: Detection of triglyceride concentration from blood collected via tail vein; E: Detection of total cholesterol concentration from blood collected via tail vein; F: Detection of free fatty acid concentration from blood collected via tail vein. aP < 0.05, bP < 0.01, cP < 0.001 vs the control sedentary group; dP < 0.05, eP < 0.01 vs the diabetic sedentary group. D-Ex: The diabetic exercise group; D-Sed: The diabetic sedentary group; C-Ex: The control exercise group; C-Sed: The control sedentary group.
- Citation: Wu YW, Wu CY, Lin F, Wu JY. Exercise training benefits pancreatic islet by modulating the insulin-like growth factor 1/phosphatidylinositol 3-kinase/protein kinase B pathway. World J Diabetes 2025; 16(5): 101447
- URL: https://www.wjgnet.com/1948-9358/full/v16/i5/101447.htm
- DOI: https://dx.doi.org/10.4239/wjd.v16.i5.101447


