Copyright
©The Author(s) 2025.
World J Diabetes. Mar 15, 2025; 16(3): 99277
Published online Mar 15, 2025. doi: 10.4239/wjd.v16.i3.99277
Published online Mar 15, 2025. doi: 10.4239/wjd.v16.i3.99277
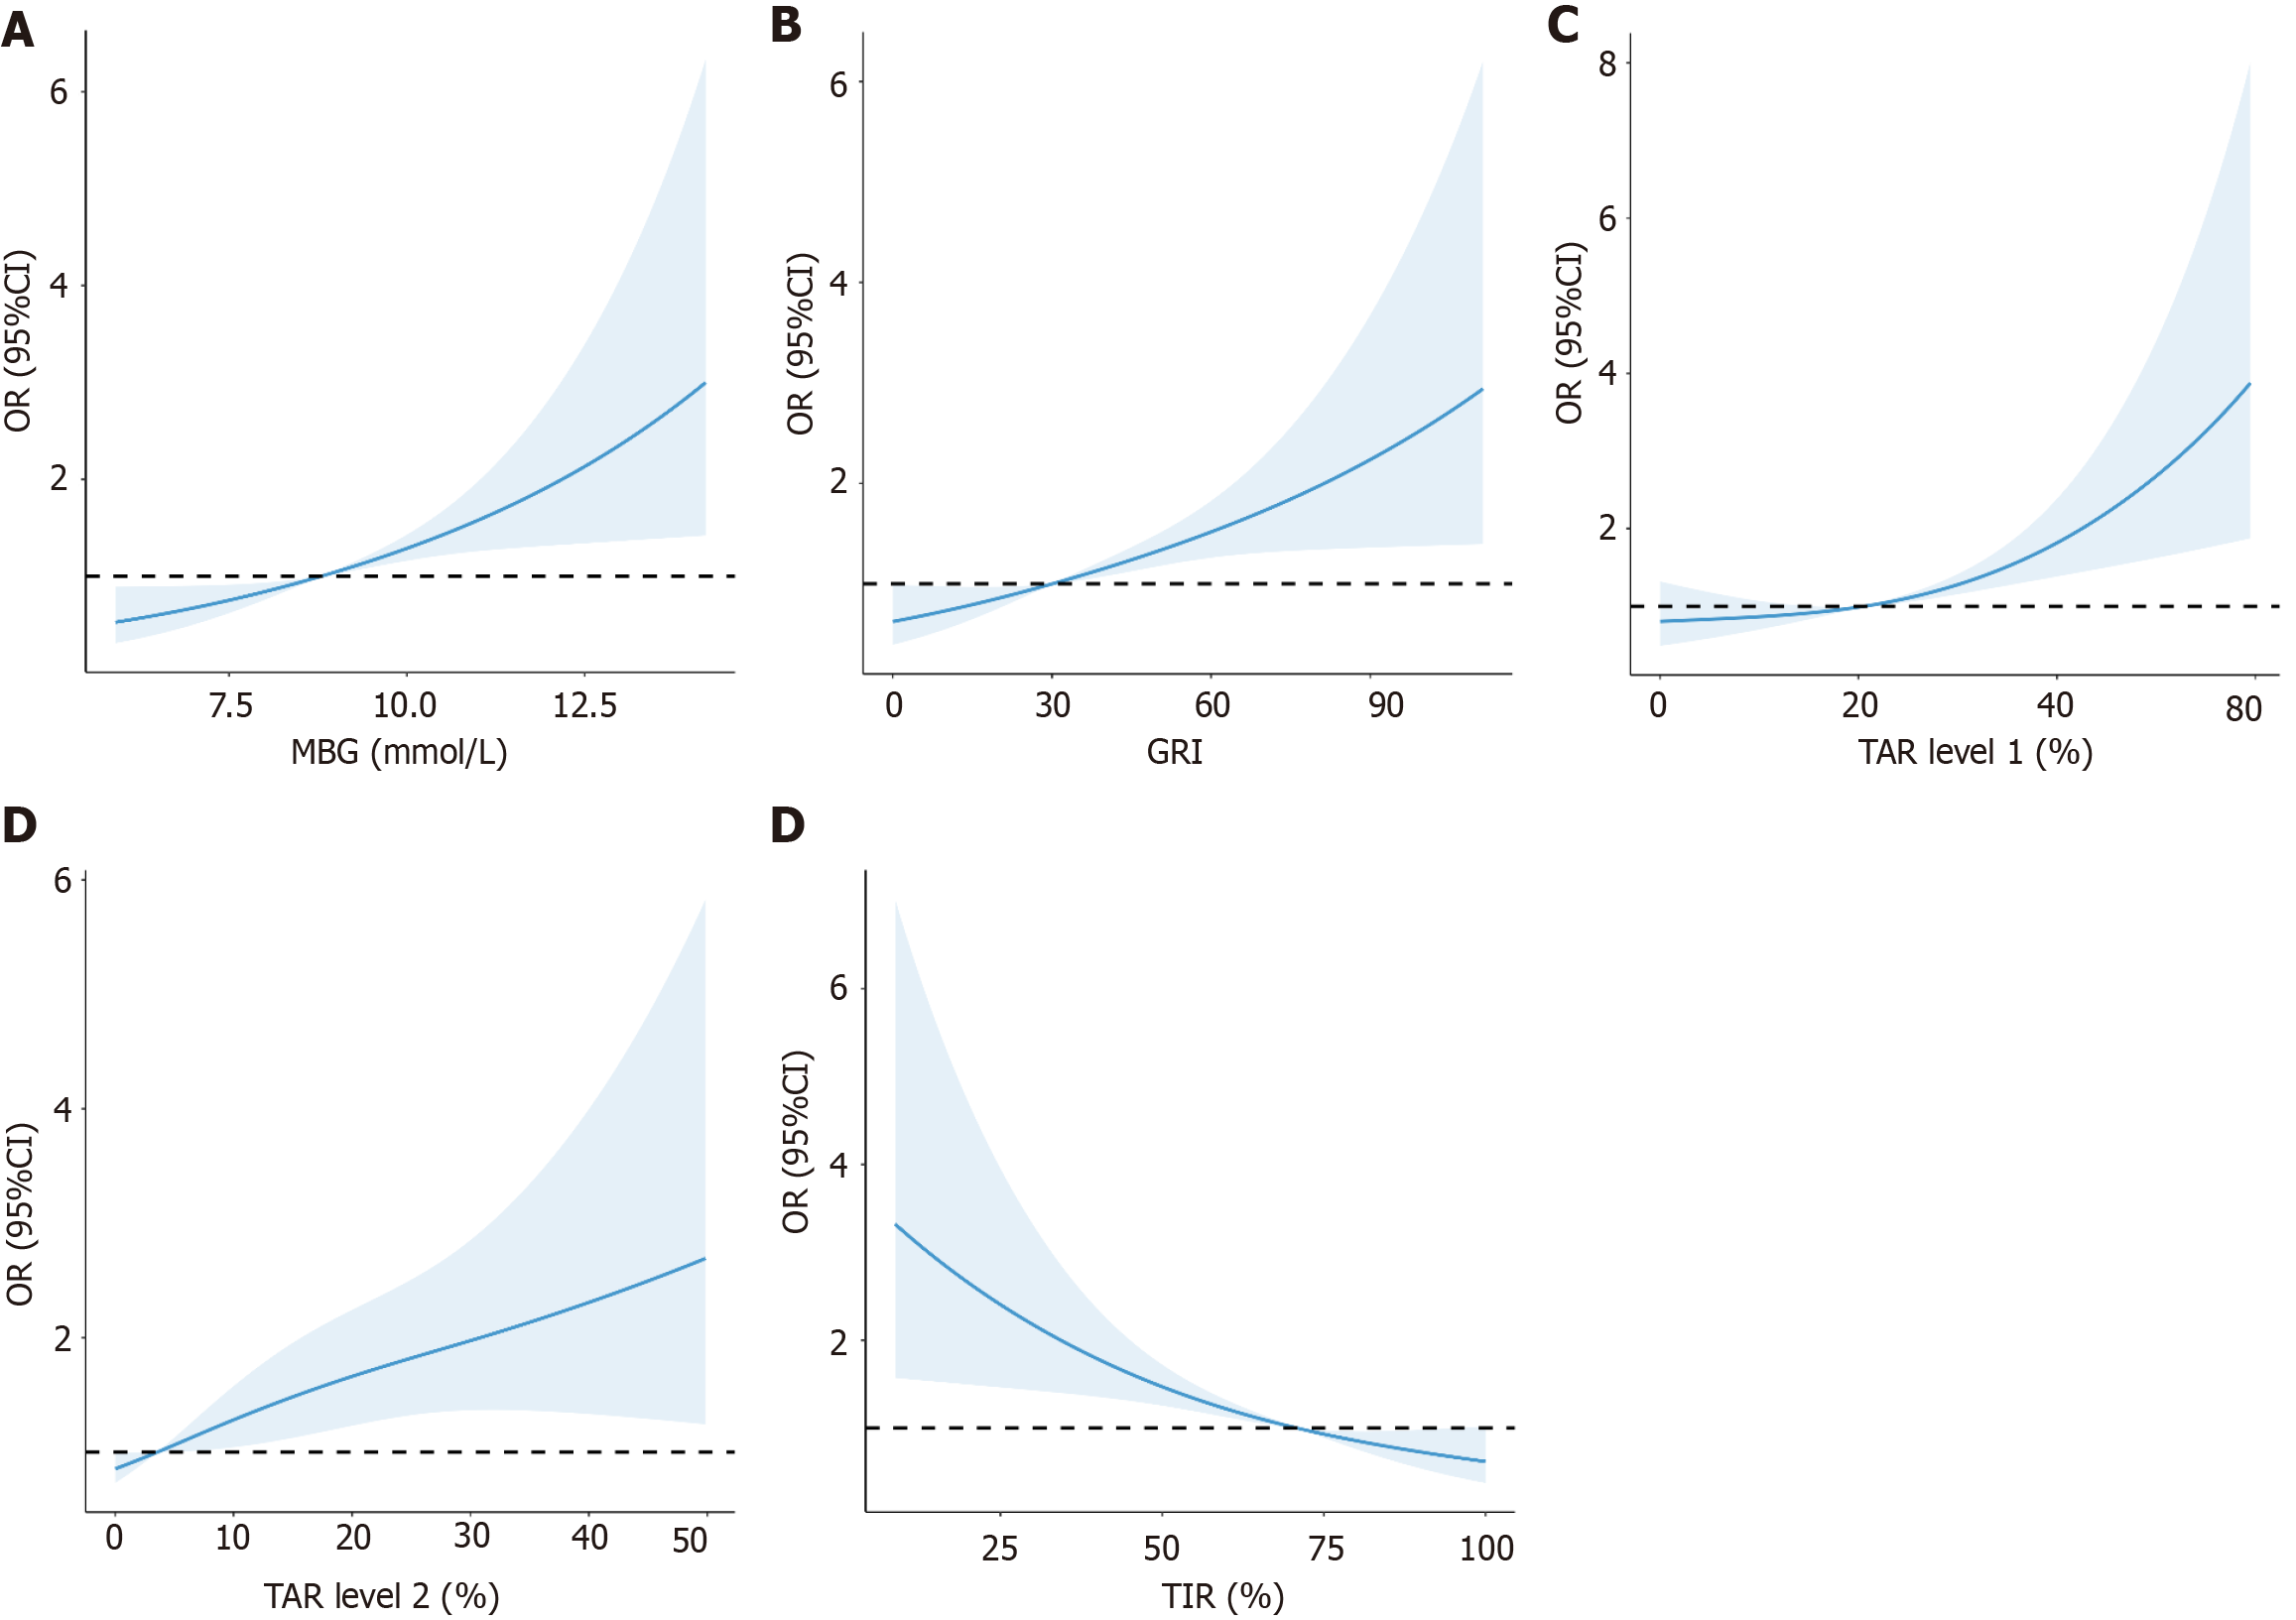
Figure 2 Restricted cubic spline model demonstrating the linear relationship of mean blood glucose, glycemia risk index, time above range level 1, time above range level 2, and time in range with the risk of diabetic foot.
A: Mean blood glucose; B: Glycemia risk index; C: Time above range (TAR) level 1; D: TAR level 2; E: Time in range. MBG: Mean blood glucose; GRI: Glycemia risk index; TAR: Time above range; TIR: Time in range.
- Citation: Geng XQ, Chen SF, Wang FY, Yang HJ, Zhao YL, Xu ZR, Yang Y. Correlation between key indicators of continuous glucose monitoring and the risk of diabetic foot. World J Diabetes 2025; 16(3): 99277
- URL: https://www.wjgnet.com/1948-9358/full/v16/i3/99277.htm
- DOI: https://dx.doi.org/10.4239/wjd.v16.i3.99277


