Copyright
©The Author(s) 2025.
World J Diabetes. Mar 15, 2025; 16(3): 97544
Published online Mar 15, 2025. doi: 10.4239/wjd.v16.i3.97544
Published online Mar 15, 2025. doi: 10.4239/wjd.v16.i3.97544
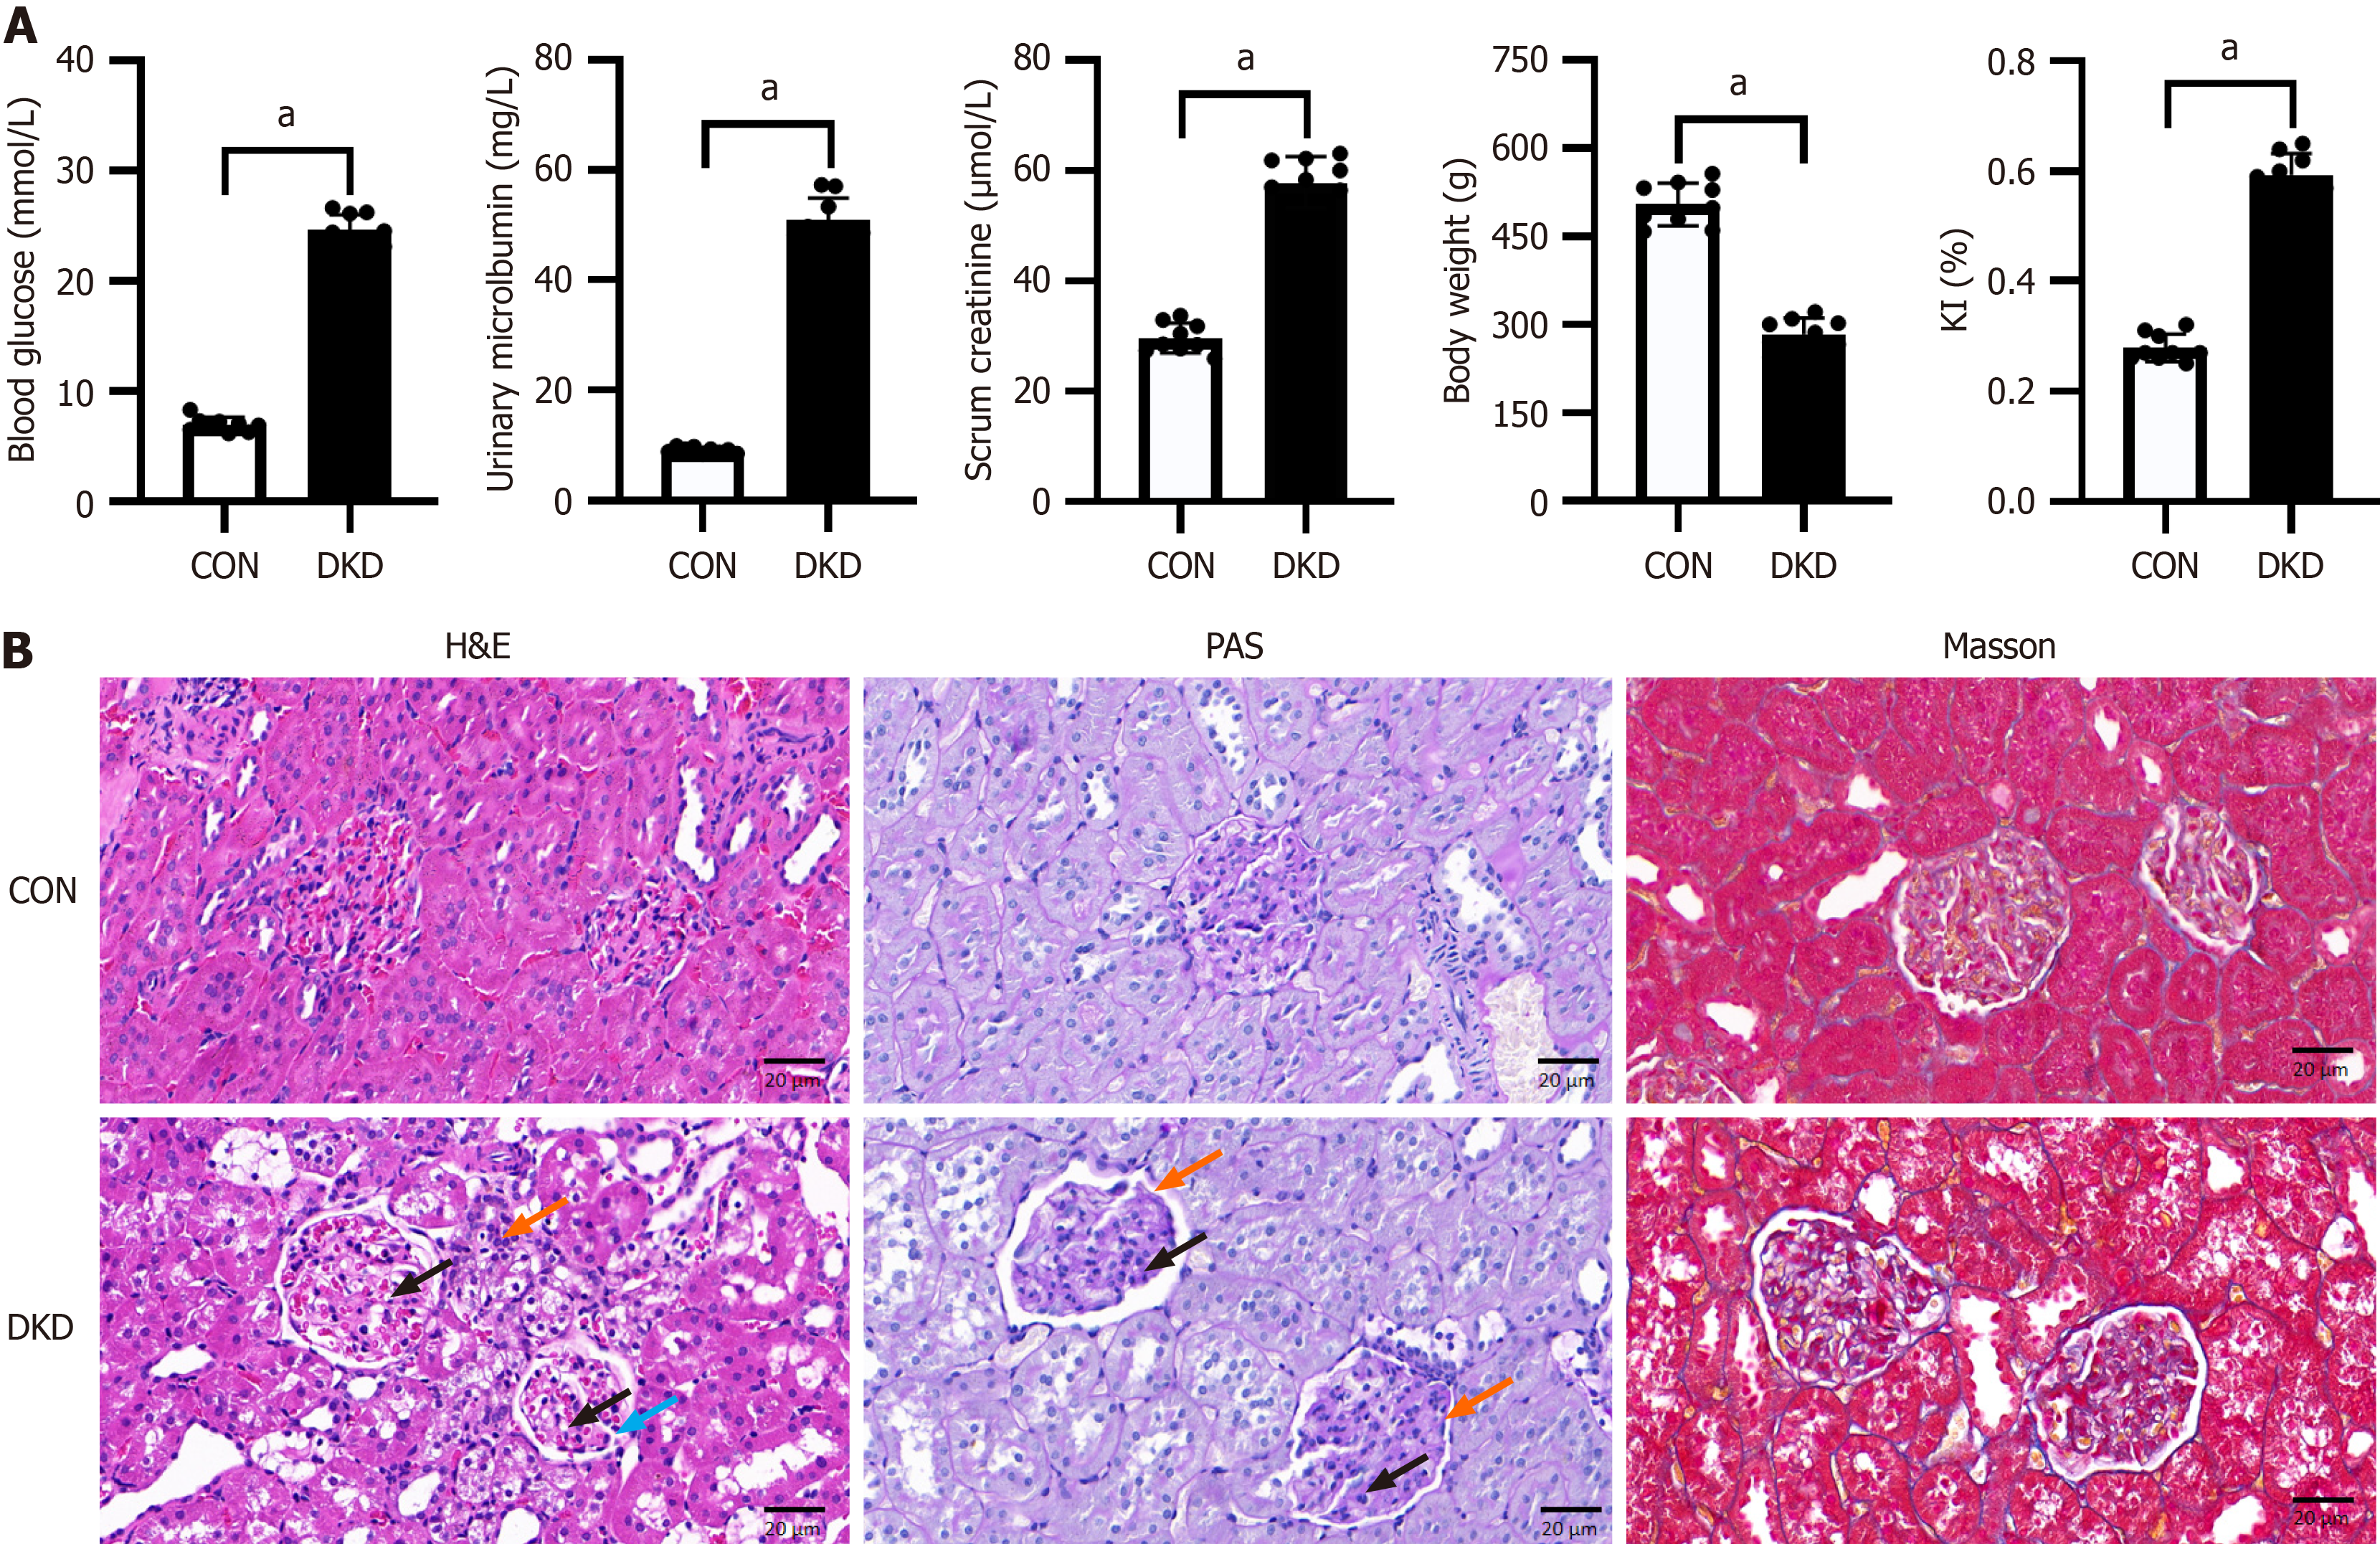
Figure 1 Metabolic indices and renal pathological alterations in diabetic kidney disease rats.
A: Comparison of blood glucose, urinary microalbumin, blood creatinine, body weight, and renal index of rats; B: Representative images of histopathological changes in the rat kidneys. Hematoxylin and eosin: Lobular structure (blue arrow), vacuolated cytoplasm (black arrow), inflammatory cell infiltration in the periphery (orange arrow); Periodic acid-Schiff: Hyperplasia of the mesangial matrix (black arrow), basement membrane thickening (orange arrow). Scale bar = 20 μm, n = 9. aP < 0.05 vs control. CON: Control; DKD: Diabetic kidney disease; KI: Kidney index.
- Citation: Li JM, Song ZH, Li Y, Chen HW, Li H, Yuan L, Li J, Lv WY, Liu L, Wang N. NR4A1 silencing alleviates high-glucose-stimulated HK-2 cells pyroptosis and fibrosis via hindering NLRP3 activation and PI3K/AKT pathway. World J Diabetes 2025; 16(3): 97544
- URL: https://www.wjgnet.com/1948-9358/full/v16/i3/97544.htm
- DOI: https://dx.doi.org/10.4239/wjd.v16.i3.97544


