Copyright
©The Author(s) 2025.
World J Diabetes. Mar 15, 2025; 16(3): 95092
Published online Mar 15, 2025. doi: 10.4239/wjd.v16.i3.95092
Published online Mar 15, 2025. doi: 10.4239/wjd.v16.i3.95092
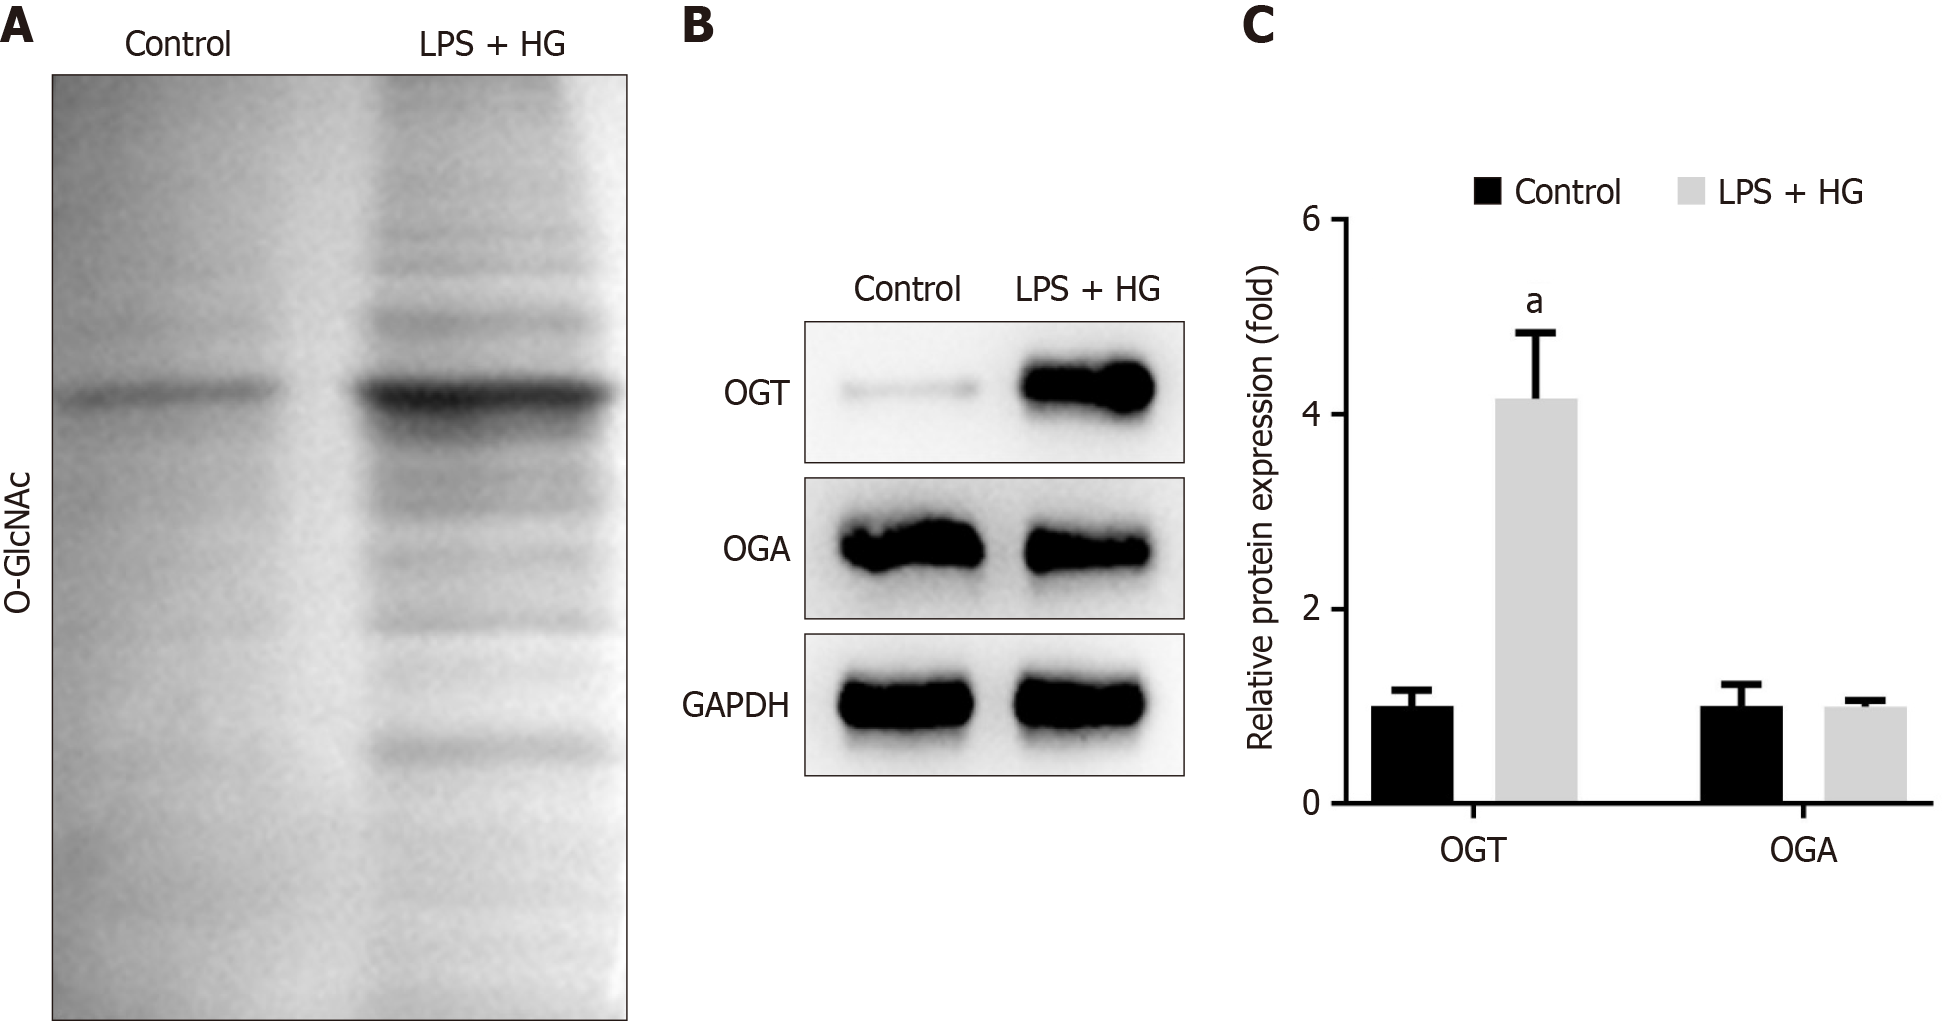
Figure 5 O-linked β-N-acetylglucosamine in RAW264.
7 Cells Treated with high glucose and lipopolysaccharide. A: Total O-linked β-N-acetylglucosamine levels; B: Protein levels of O-GlcNAc transferase (OGT) and O-GlcNAcase (OGA) were measured by Western blot; C: Protein levels of OGT and OGA were quantified. aP < 0.001. P value calculated vs control. LPS: Lipopolysaccharide; HG: High glucose; OGT: O-GlcNAc transferase; OGA: O-GlcNAcase; GAPDH: Glyceraldehyde-3-phosphate dehydrogenase.
- Citation: Wu YK, Liu M, Zhou HL, He X, Wei J, Hua WH, Li HJ, Yuan QH, Xie YF. O-linked β-N-acetylglucosamine transferase regulates macrophage polarization in diabetic periodontitis: In vivo and in vitro study. World J Diabetes 2025; 16(3): 95092
- URL: https://www.wjgnet.com/1948-9358/full/v16/i3/95092.htm
- DOI: https://dx.doi.org/10.4239/wjd.v16.i3.95092


