Copyright
©The Author(s) 2025.
World J Diabetes. Mar 15, 2025; 16(3): 95092
Published online Mar 15, 2025. doi: 10.4239/wjd.v16.i3.95092
Published online Mar 15, 2025. doi: 10.4239/wjd.v16.i3.95092
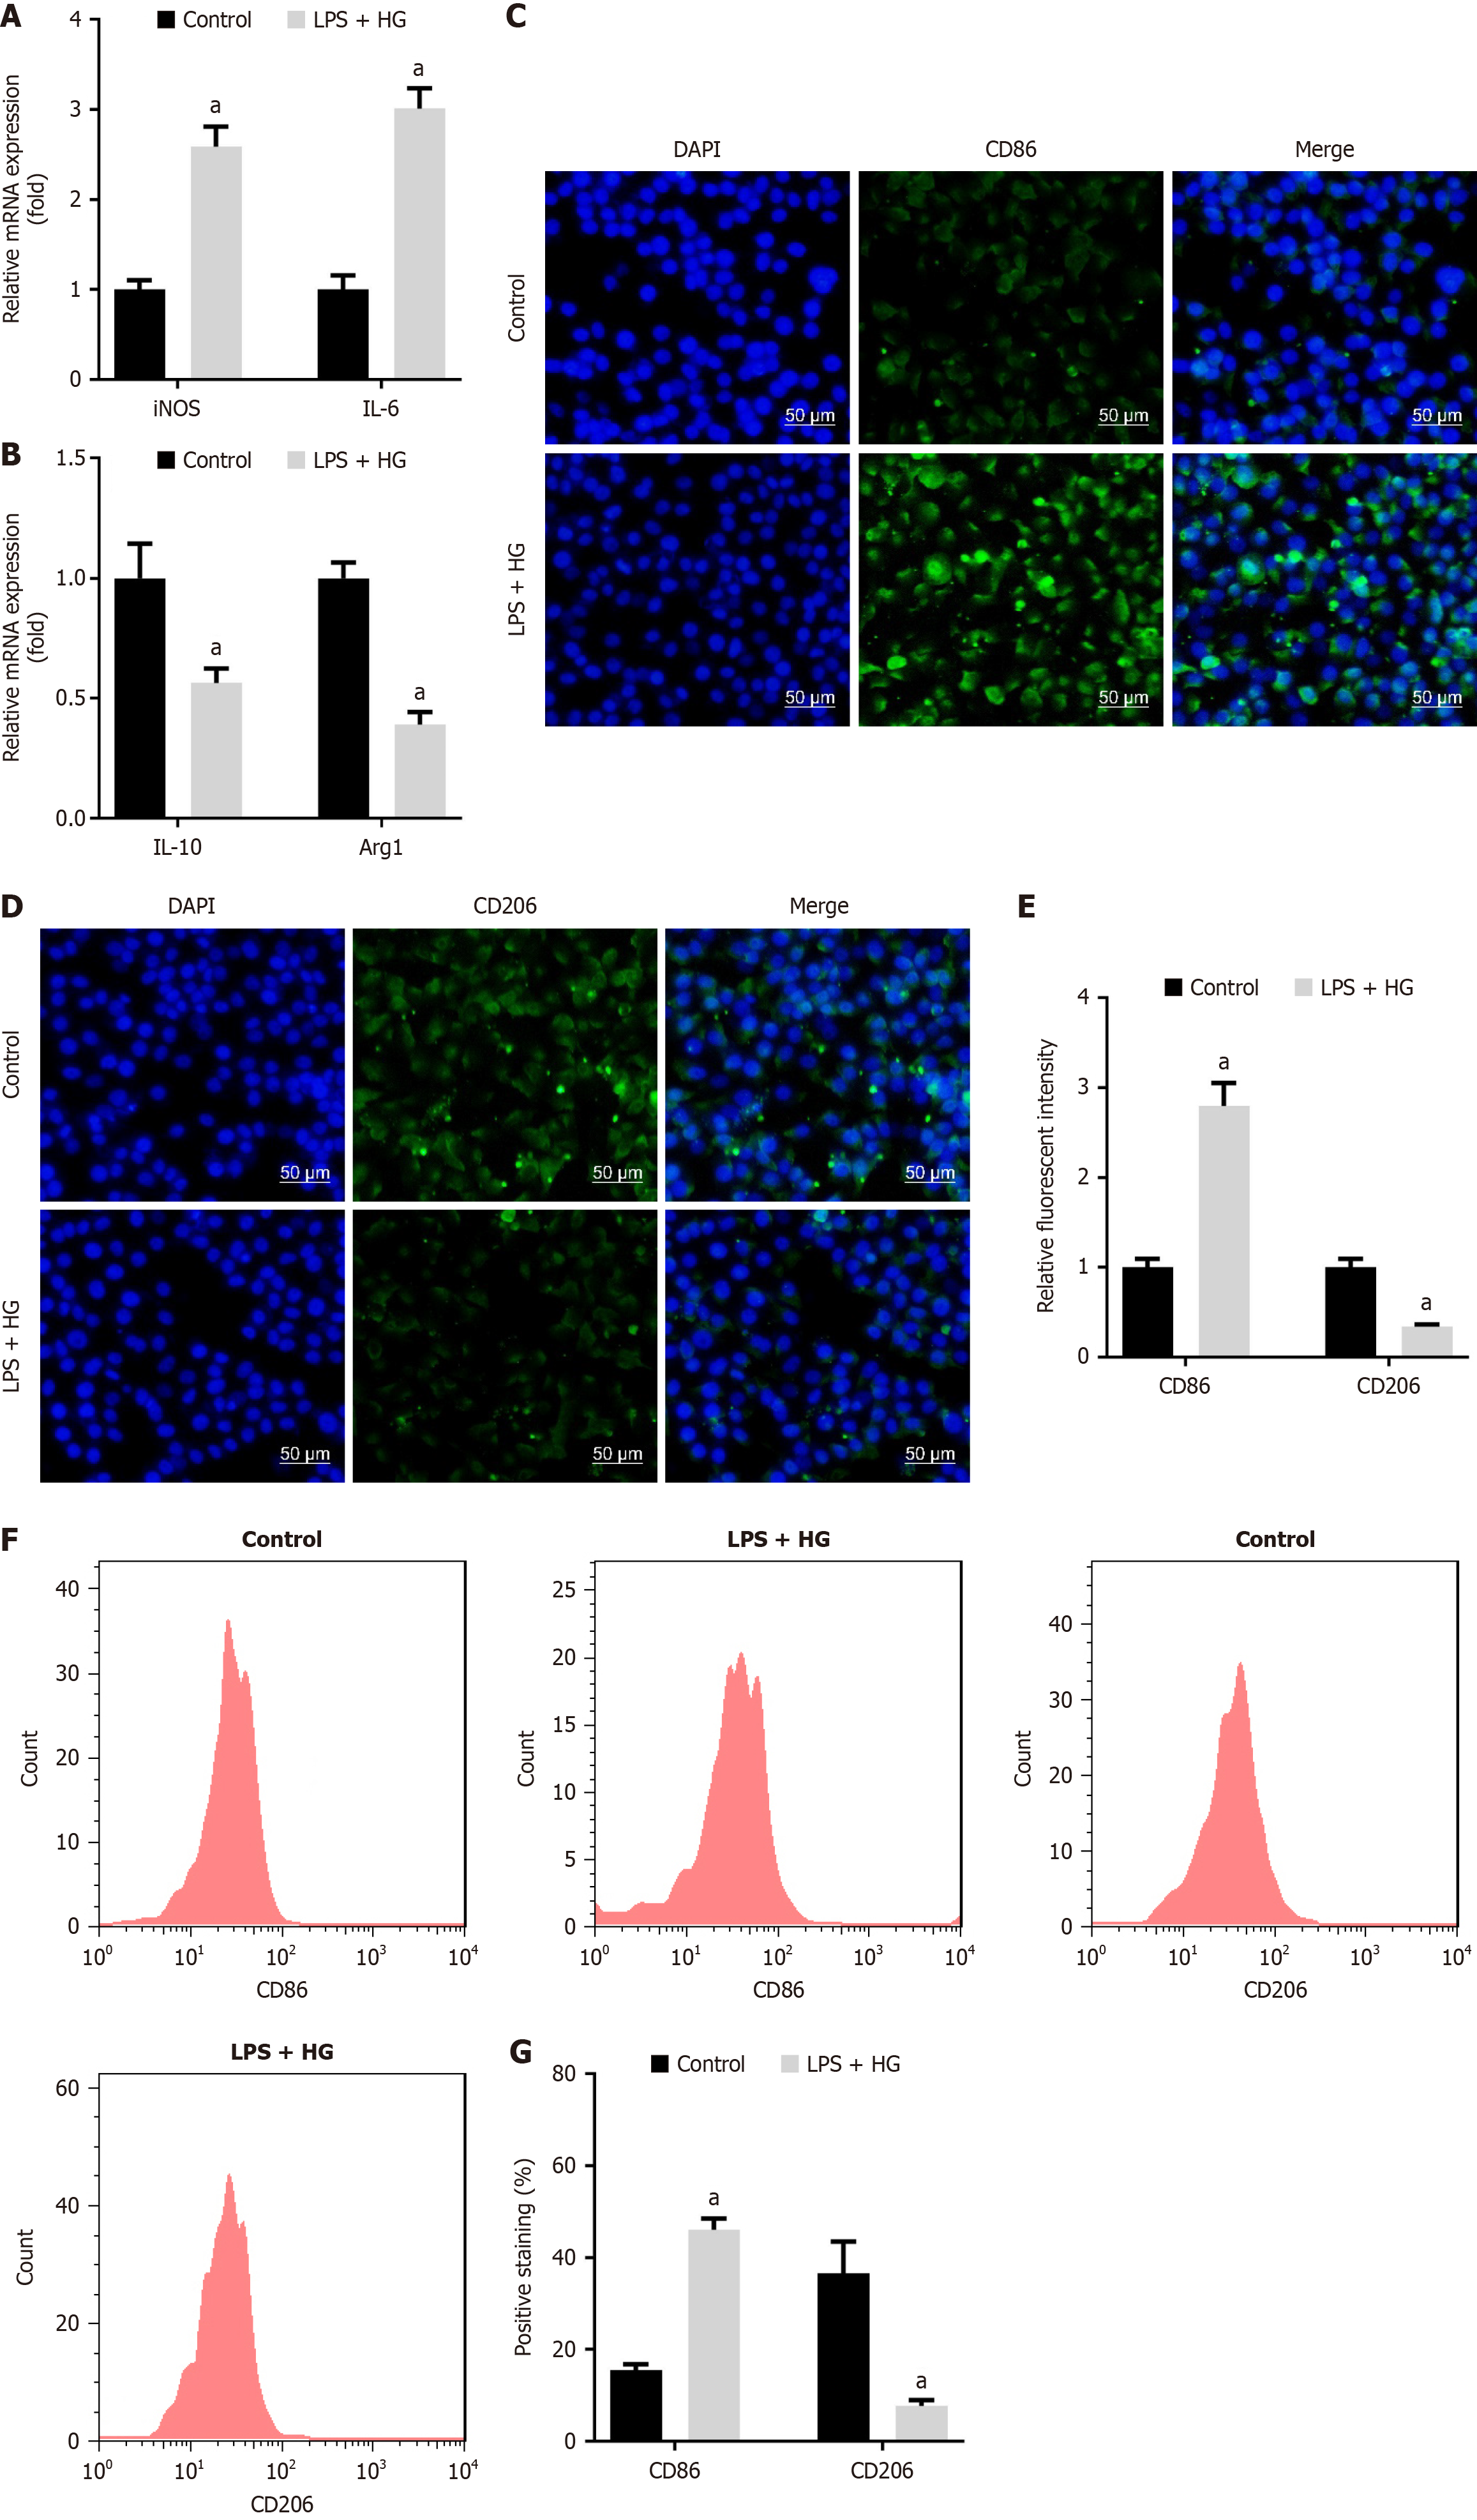
Figure 3 Lipopolysaccharide and high glucose promote macrophage polarization to M1 phenotype.
A: mRNA expression of inducible nitric oxide synthase and interleukin-6; B: Interleukin-10 and arginase 1 was measured using quantitative real-time polymerase chain reaction; C: Cluster of differentiation (CD) 86; D: CD206 levels were examined using immunofluorescence staining (Scale bar: 50 μm); E: Relative fluorescent intensity of CD86 and CD206 was quantified; F and G: CD86 and CD206 levels were detected and quantified using flow cytometry. aP < 0.05. P value calculated vs control. LPS: Lipopolysaccharide; HG: High glucose; iNOS: Inducible nitric oxide synthase; IL: Interleukin; Arg1: Arginase 1; CD: Cluster of differentiation; DAPI: 4’,6-Diamidino-2-phenylindole.
- Citation: Wu YK, Liu M, Zhou HL, He X, Wei J, Hua WH, Li HJ, Yuan QH, Xie YF. O-linked β-N-acetylglucosamine transferase regulates macrophage polarization in diabetic periodontitis: In vivo and in vitro study. World J Diabetes 2025; 16(3): 95092
- URL: https://www.wjgnet.com/1948-9358/full/v16/i3/95092.htm
- DOI: https://dx.doi.org/10.4239/wjd.v16.i3.95092


