Copyright
©The Author(s) 2025.
World J Diabetes. Mar 15, 2025; 16(3): 92003
Published online Mar 15, 2025. doi: 10.4239/wjd.v16.i3.92003
Published online Mar 15, 2025. doi: 10.4239/wjd.v16.i3.92003
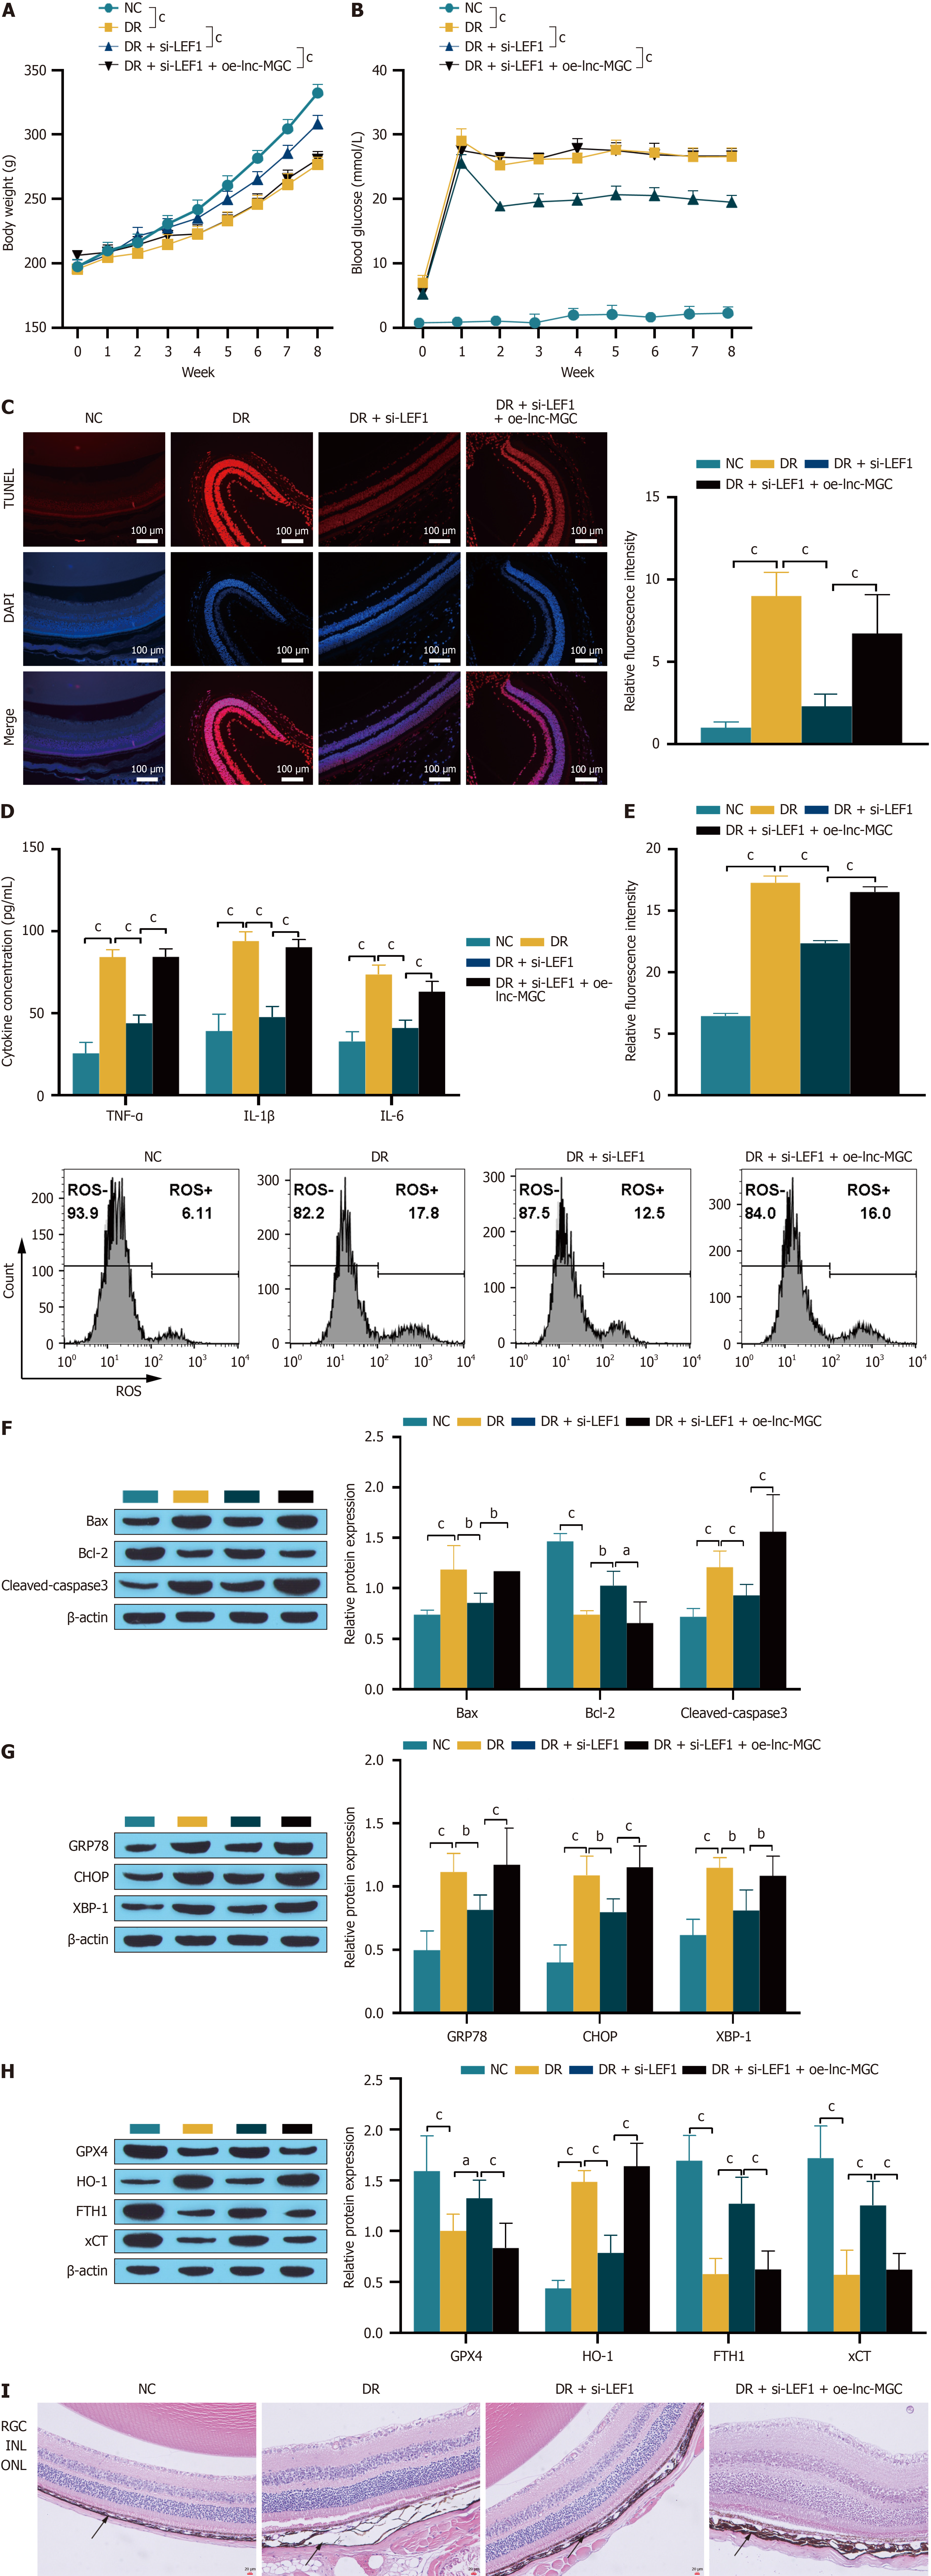
Figure 9 Animal experiments to verify that LEF1 combined with lnc-MGC regulates diabetic retinopathy progression.
A and B: Diabetic retinopathy rat body weight and blood glucose detection; C: A TUNEL assay was used to detect apoptosis. The scale bar represents 100 μm; D: ELISA was used to detect the expression of the inflammatory factors TNF-α, IL-1β and IL-6; E: Reactive oxygen species were detected by flow cytometry; F-H: Western blotting was used to detect the expression of related proteins; I: HE staining was used to observe the retinal structure. The scale bar represents 20 μm. aP < 0.05, bP < 0.01, and cP < 0.001. ONL: Outer nuclear layer; INL: Inner core layer; RGC: retinal ganglion cells; NC: Normal control; DR: Diabetic retinopathy; ROS: Reactive oxygen species.
- Citation: Luo YY, Ba XY, Wang L, Zhang YP, Xu H, Chen PQ, Zhang LB, Han J, Luo H. LEF1 influences diabetic retinopathy and retinal pigment epithelial cell ferroptosis via the miR-495-3p/GRP78 axis through lnc-MGC. World J Diabetes 2025; 16(3): 92003
- URL: https://www.wjgnet.com/1948-9358/full/v16/i3/92003.htm
- DOI: https://dx.doi.org/10.4239/wjd.v16.i3.92003


