Copyright
©The Author(s) 2025.
World J Diabetes. Mar 15, 2025; 16(3): 102277
Published online Mar 15, 2025. doi: 10.4239/wjd.v16.i3.102277
Published online Mar 15, 2025. doi: 10.4239/wjd.v16.i3.102277
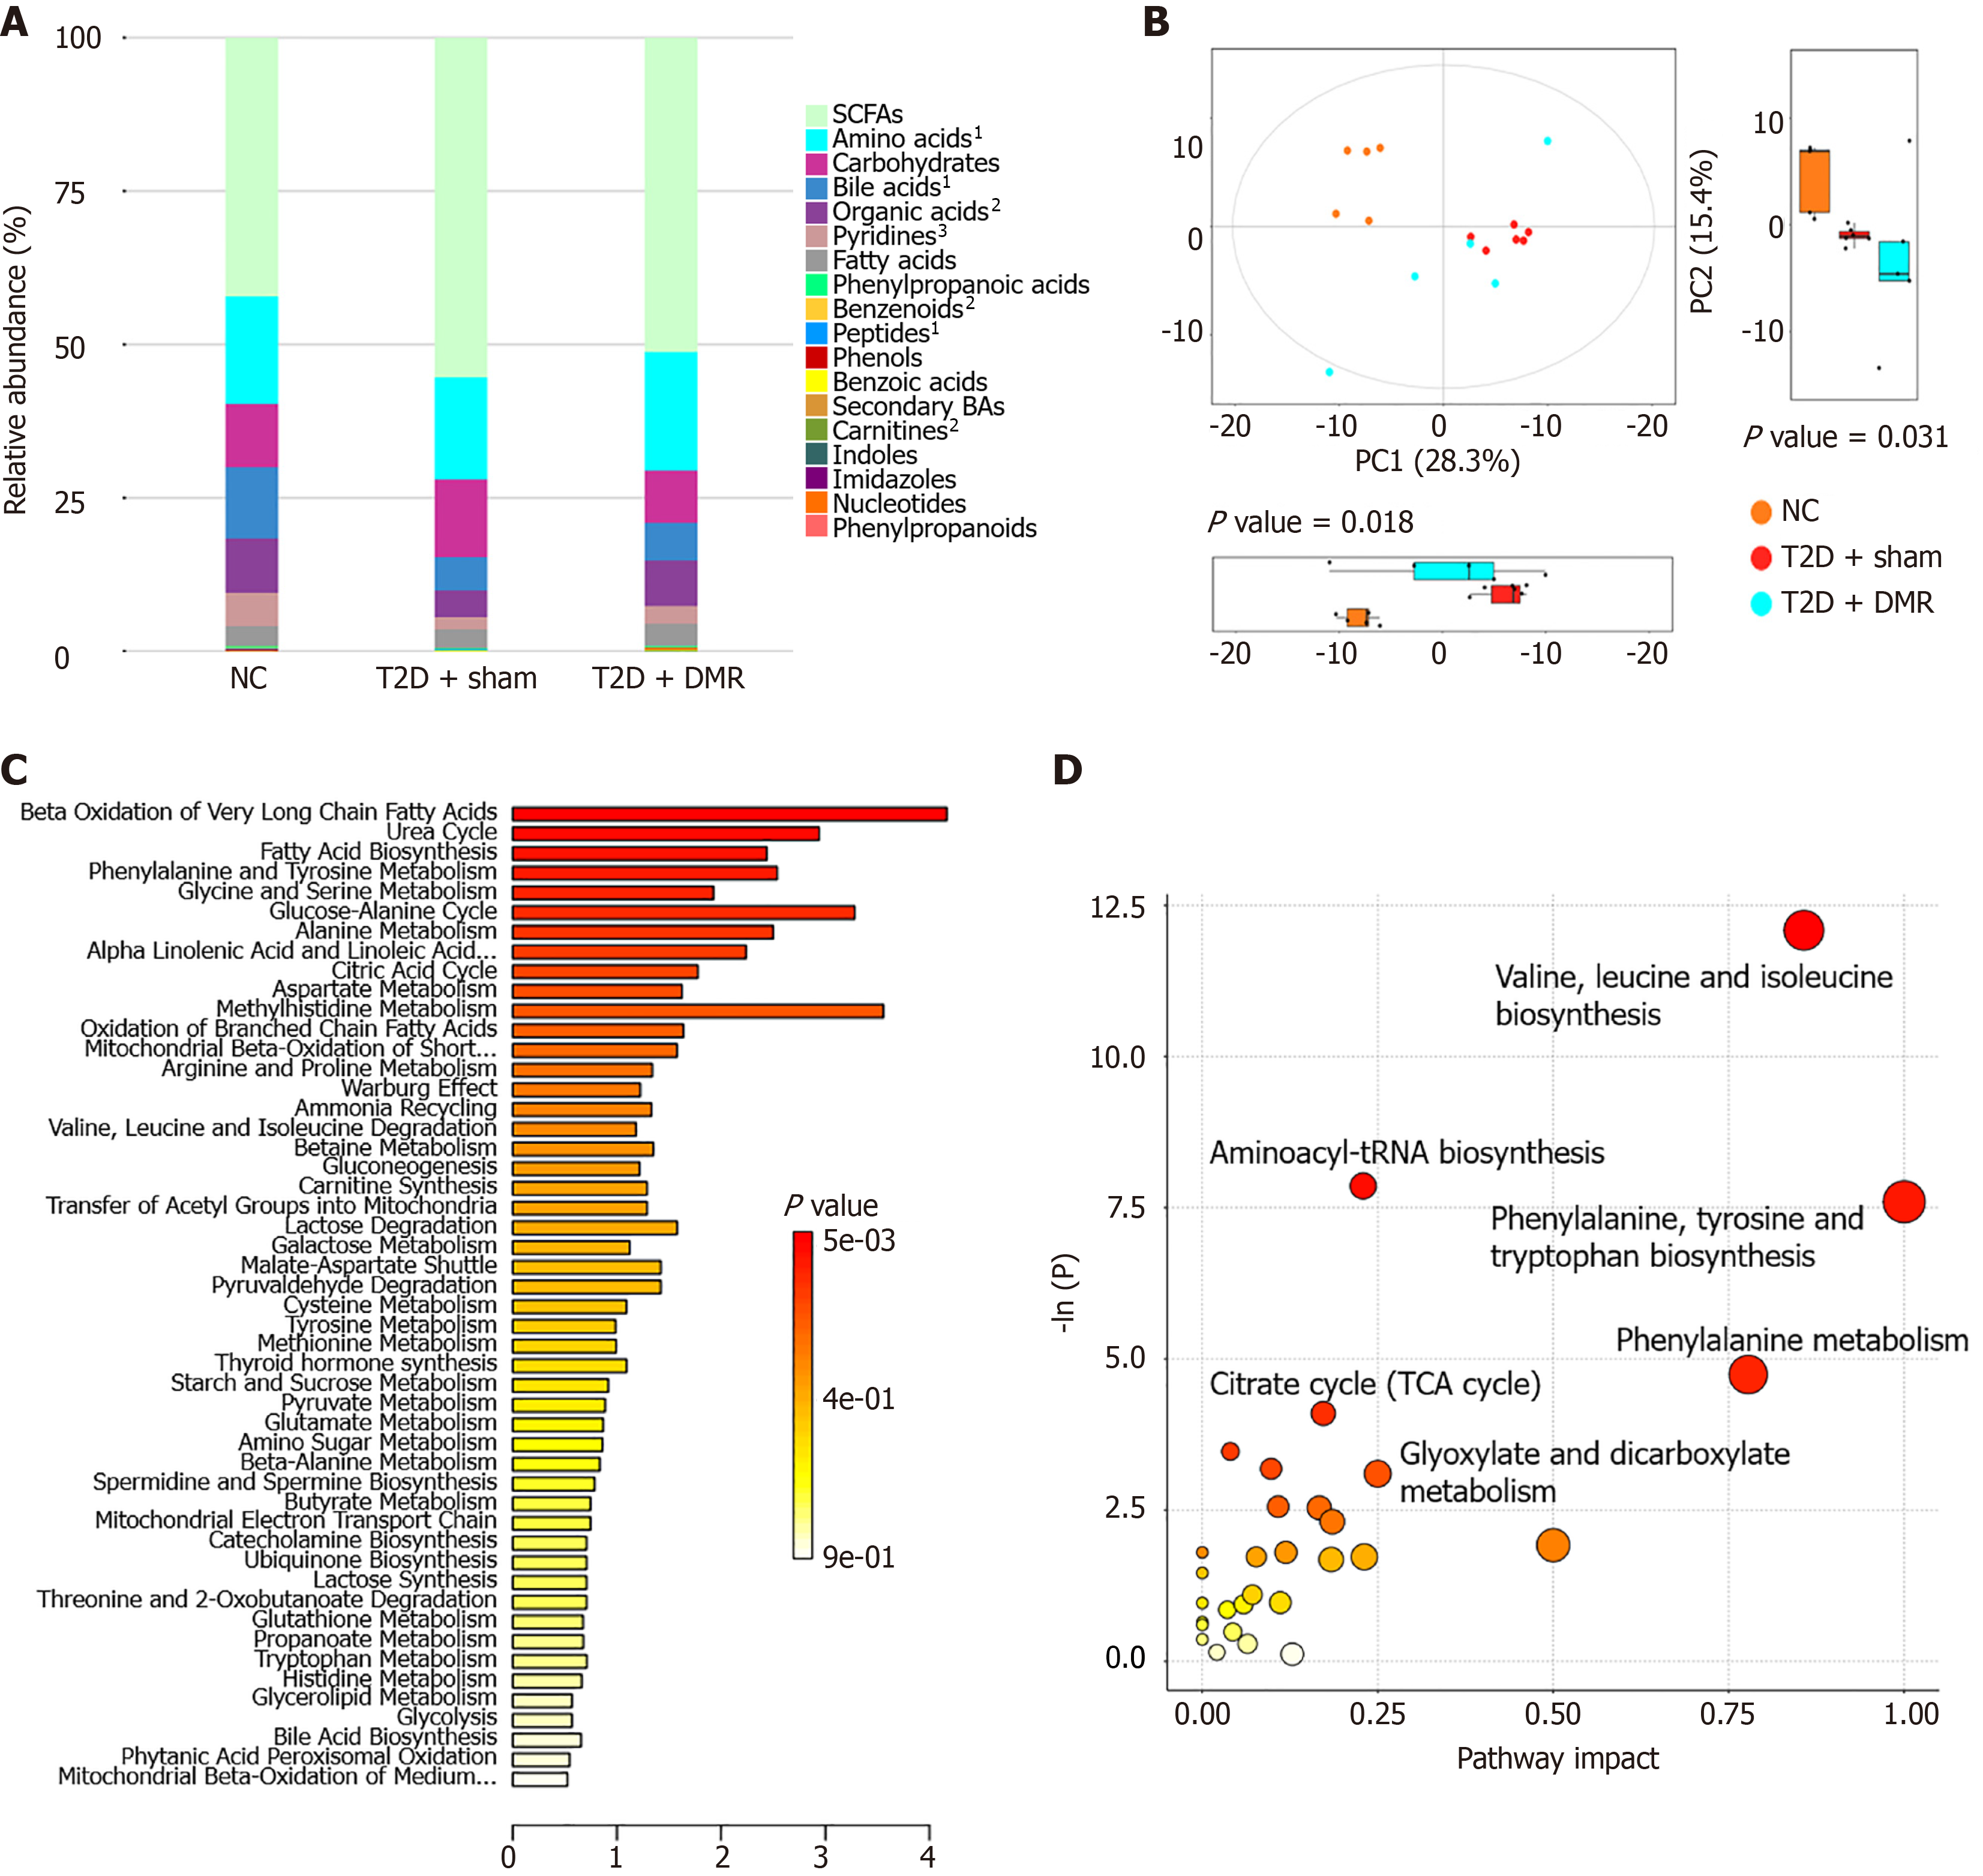
Figure 6 Metabolites and prospective metabolic pathways related to type 2 diabetes and the duodenal mucosal resurfacing procedure.
A: Stacked bar chart of relative abundance statistics for the median values of various metabolites in the colonic contents of rats; B: Two-dimensional principal component analysis score map of colonic contents samples and corresponding box plot of principal component analysis scores; C: Bar chart of small molecule pathway database-associated metabolite sets used in the pathway enrichment analysis; D: Bubble chart of the rno library pathway analysis. 1P < 0.05. 2P < 0.01. 3P < 0.001. DMR: Duodenal mucosal resurfacing; NC: Normal control; SCFA: Short-chain fatty acid; T2D: Type 2 diabetes; BAs: Bile Acids; PC1: Principal component 1; PC2: Principal component 2; TCA: Taurocholic acid.
- Citation: Nie LJ, Cheng Z, He YX, Yan QH, Sun YH, Yang XY, Tian J, Zhu PF, Yu JY, Zhou HP, Zhou XQ. Role of duodenal mucosal resurfacing in controlling diabetes in rats. World J Diabetes 2025; 16(3): 102277
- URL: https://www.wjgnet.com/1948-9358/full/v16/i3/102277.htm
- DOI: https://dx.doi.org/10.4239/wjd.v16.i3.102277


