Copyright
©The Author(s) 2025.
World J Diabetes. Mar 15, 2025; 16(3): 102277
Published online Mar 15, 2025. doi: 10.4239/wjd.v16.i3.102277
Published online Mar 15, 2025. doi: 10.4239/wjd.v16.i3.102277
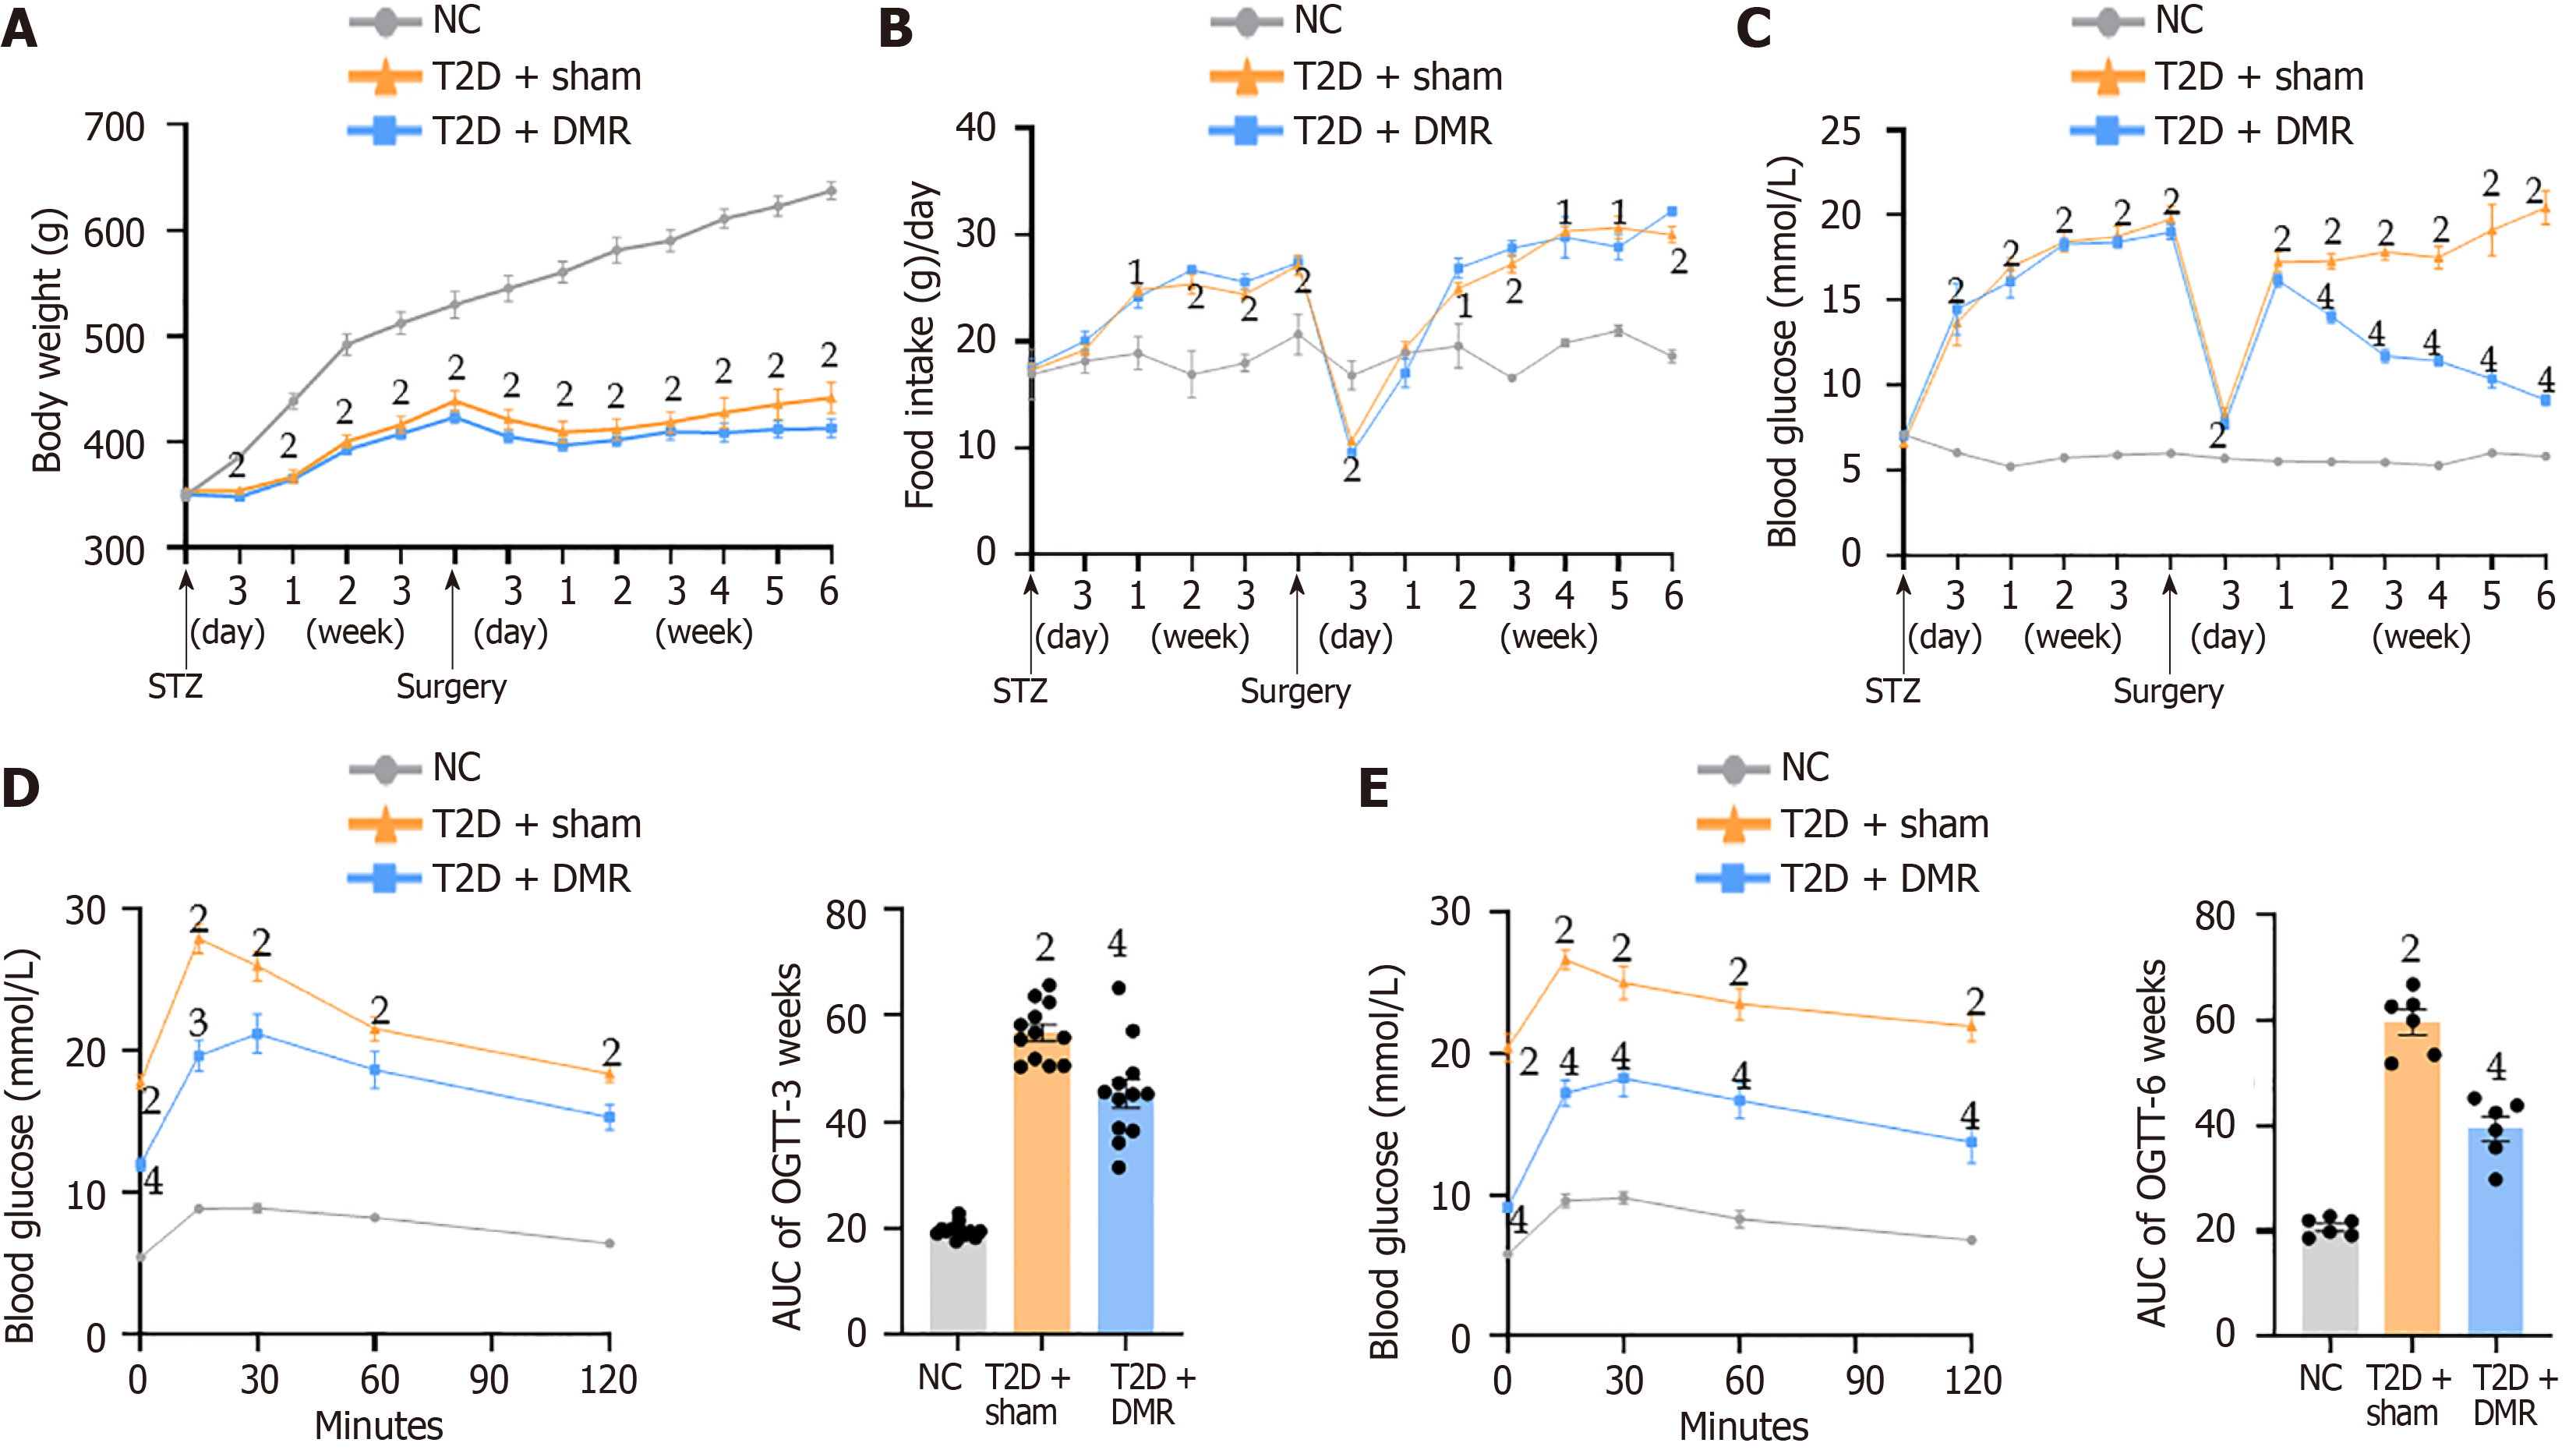
Figure 2 Effects of the duodenal mucosal resurfacing procedure on phenotypic changes in type 2 diabetes rats.
A-C: Body weight, food intake and fasting blood glucose throughout the experimental period after intraperitoneal injection of streptozotocin (n = 6 or 12 mice per group); D and E: Glucose excursion curves and the area under curve of oral glucose tolerance tests performed at postoperative weeks 3 (n = 12 mice per group) and 6 (n = 6 mice per group). Data are presented as mean ± SE. 1P < 0.01 vs normal control group. 2P < 0.001 vs normal control group. 3P < 0.01 vs type 2 diabetes-sham group. 4P < 0.001 vs type 2 diabetes-sham group. DMR: Duodenal mucosal resurfacing; T2D: Type 2 diabetes; NC: Normal control; STZ: Streptozotocin; OGTT: Oral glucose tolerance test; AUC: Area under curve.
- Citation: Nie LJ, Cheng Z, He YX, Yan QH, Sun YH, Yang XY, Tian J, Zhu PF, Yu JY, Zhou HP, Zhou XQ. Role of duodenal mucosal resurfacing in controlling diabetes in rats. World J Diabetes 2025; 16(3): 102277
- URL: https://www.wjgnet.com/1948-9358/full/v16/i3/102277.htm
- DOI: https://dx.doi.org/10.4239/wjd.v16.i3.102277


