Copyright
©The Author(s) 2025.
World J Diabetes. Feb 15, 2025; 16(2): 99053
Published online Feb 15, 2025. doi: 10.4239/wjd.v16.i2.99053
Published online Feb 15, 2025. doi: 10.4239/wjd.v16.i2.99053
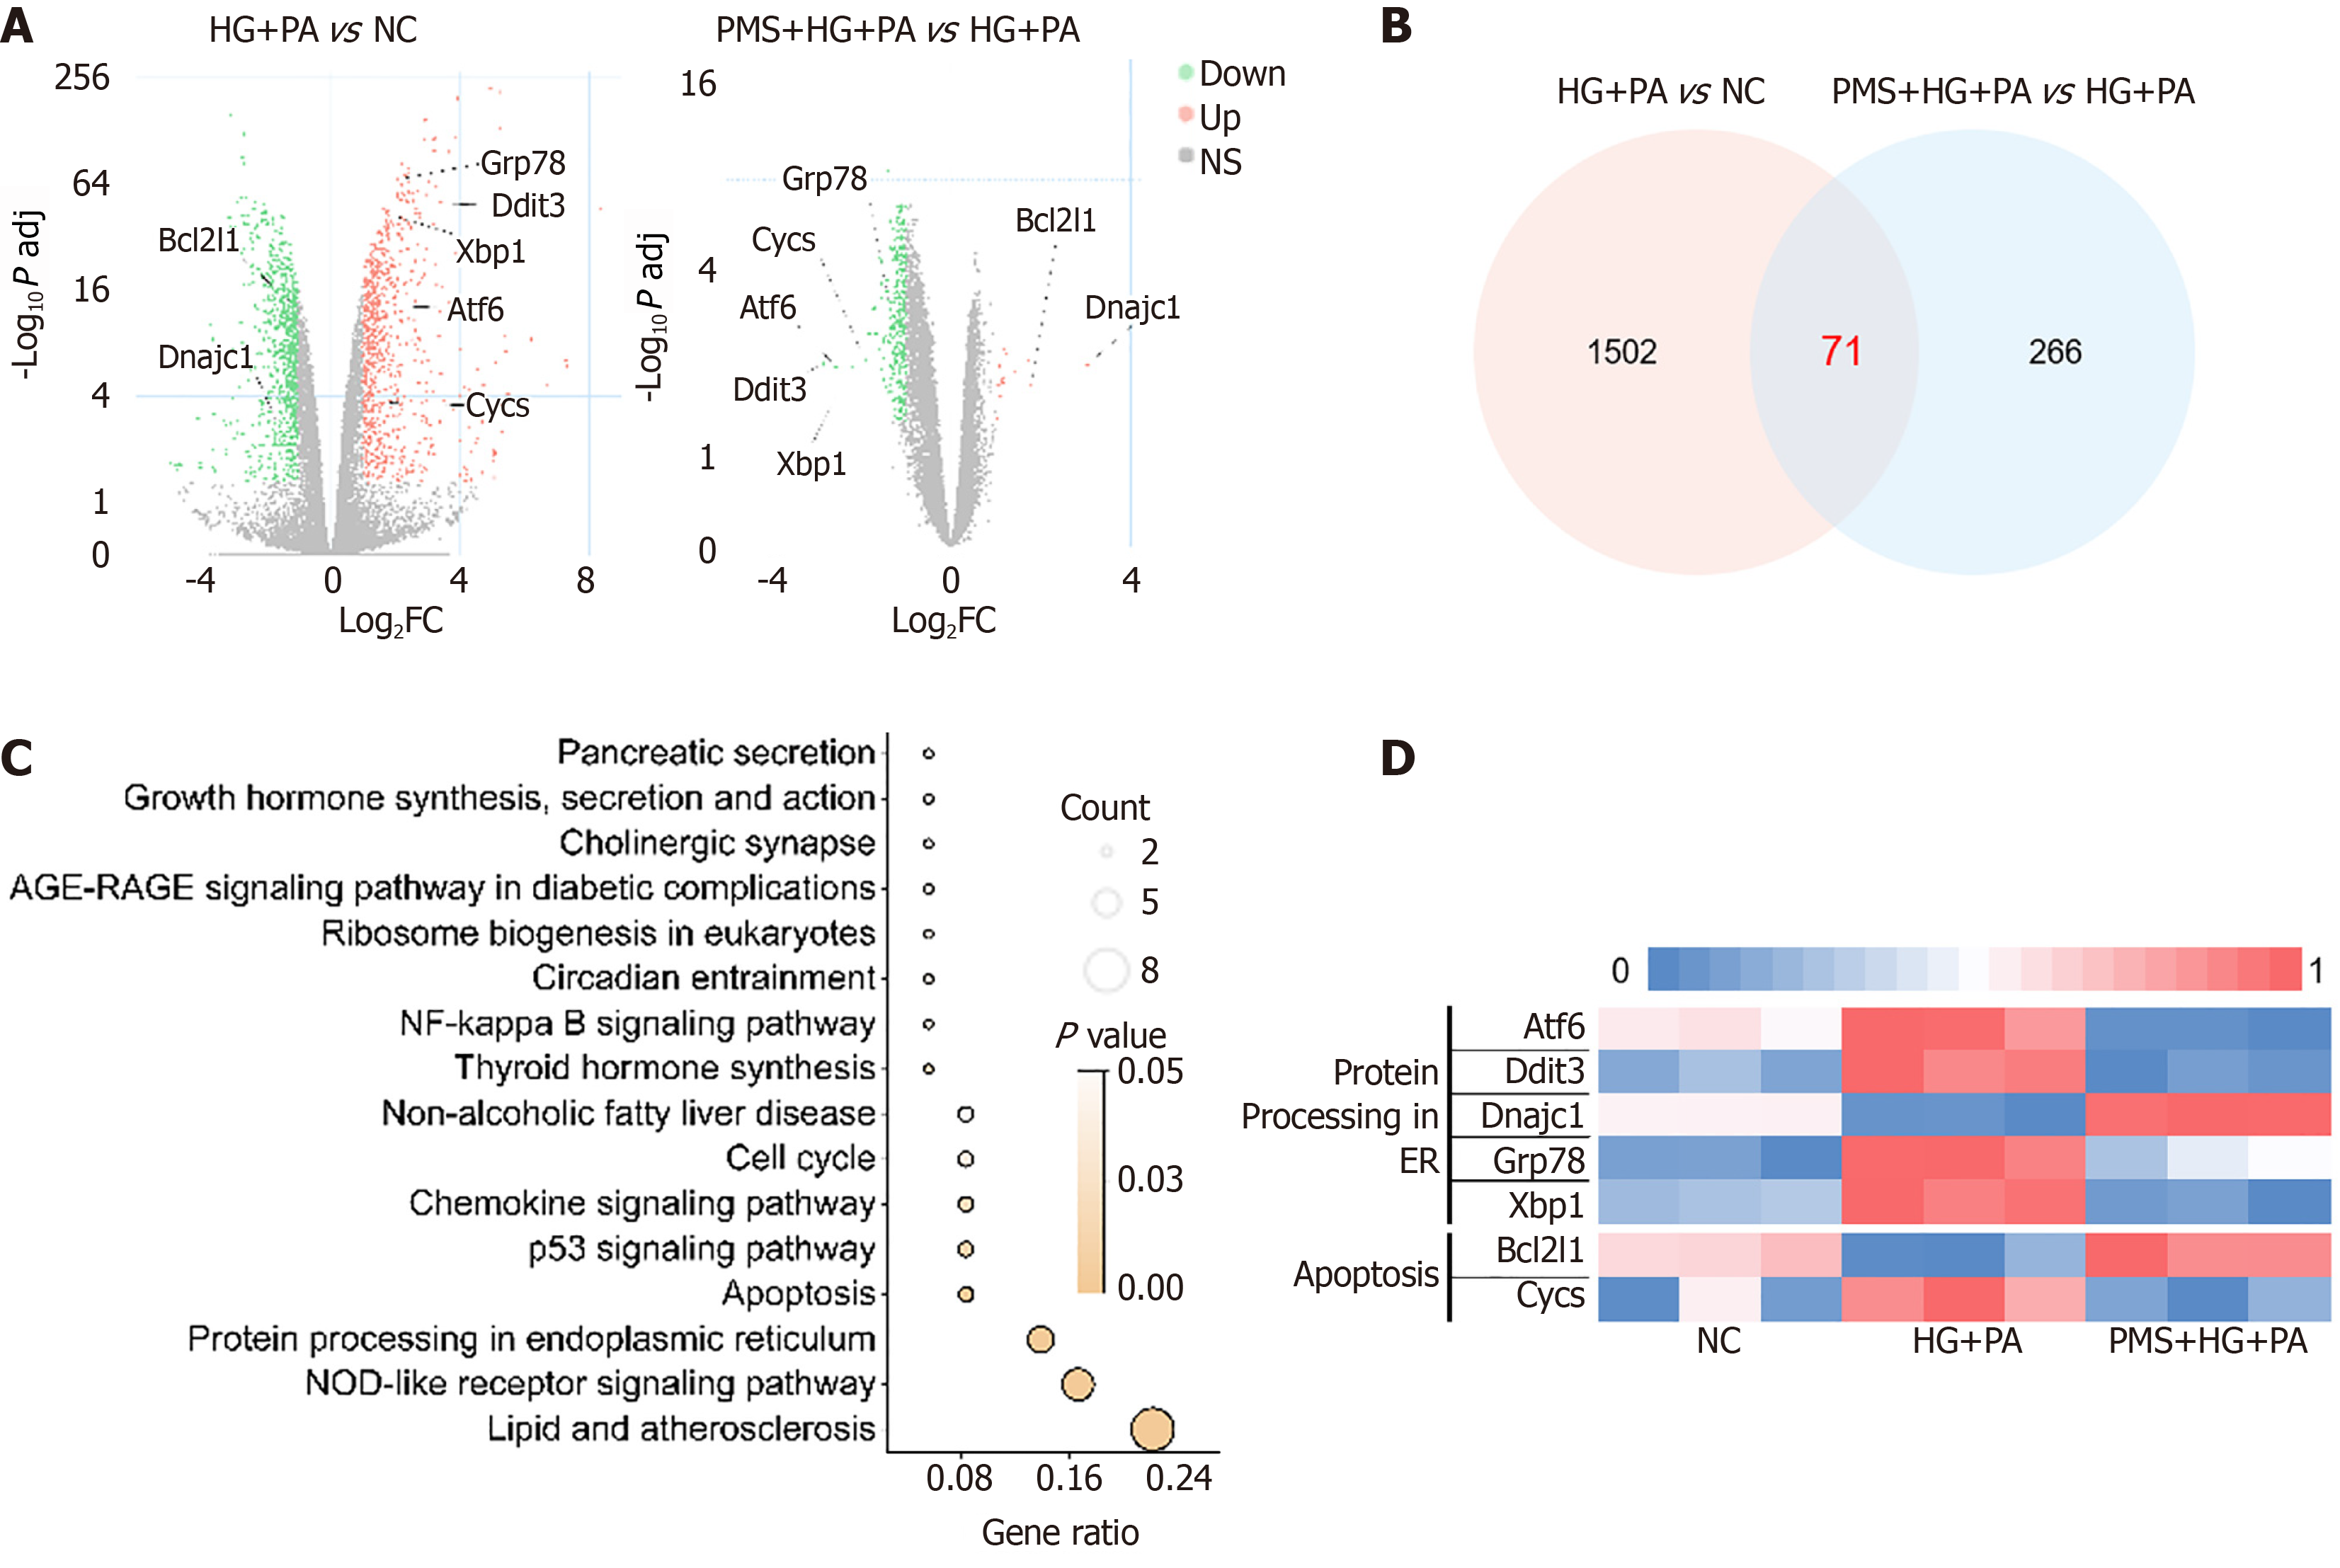
Figure 2 Impact of plantamajoside intervention on gene expression in high glucose + palmitic acid-induced pancreatic β-cells using transcriptomics.
Differentially expressed genes between high glucose (HG) + palmitic acid (PA) vs normal control (NC) groups, and plantamajoside (PMS) + HG + PA vs HG + PA groups, filtered based on P adj < 0.05 and |Log2 (Fold change)| > 1. A: Genes were visualized using volcano plots; B: With the intersecting genes depicted in Venn diagrams; C: KEGG pathway enrichment analysis of intersecting genes revealing that protein processing in the endoplasmic reticulum and apoptosis pathways are enriched following PMS intervention; D: Expression of apoptosis pathway-related genes visualized using a heatmap, showing that PMS intervention upregulated Bcl-2 and downregulated Bax and CytC. Expression of genes related to protein processing in the endoplasmic reticulum pathway visualized using a heatmap, demonstrating that PMS intervention upregulated Dnajc1 and downregulated ATF6, XBP1, Ddit3 (CHOP)and GRP78. n = 6 per group.
- Citation: Wang D, Wang YS, Zhao HM, Lu P, Li M, Li W, Cui HT, Zhang ZY, Lv SQ. Plantamajoside improves type 2 diabetes mellitus pancreatic β-cell damage by inhibiting endoplasmic reticulum stress through Dnajc1 up-regulation. World J Diabetes 2025; 16(2): 99053
- URL: https://www.wjgnet.com/1948-9358/full/v16/i2/99053.htm
- DOI: https://dx.doi.org/10.4239/wjd.v16.i2.99053


