Copyright
©The Author(s) 2025.
World J Diabetes. Feb 15, 2025; 16(2): 98423
Published online Feb 15, 2025. doi: 10.4239/wjd.v16.i2.98423
Published online Feb 15, 2025. doi: 10.4239/wjd.v16.i2.98423
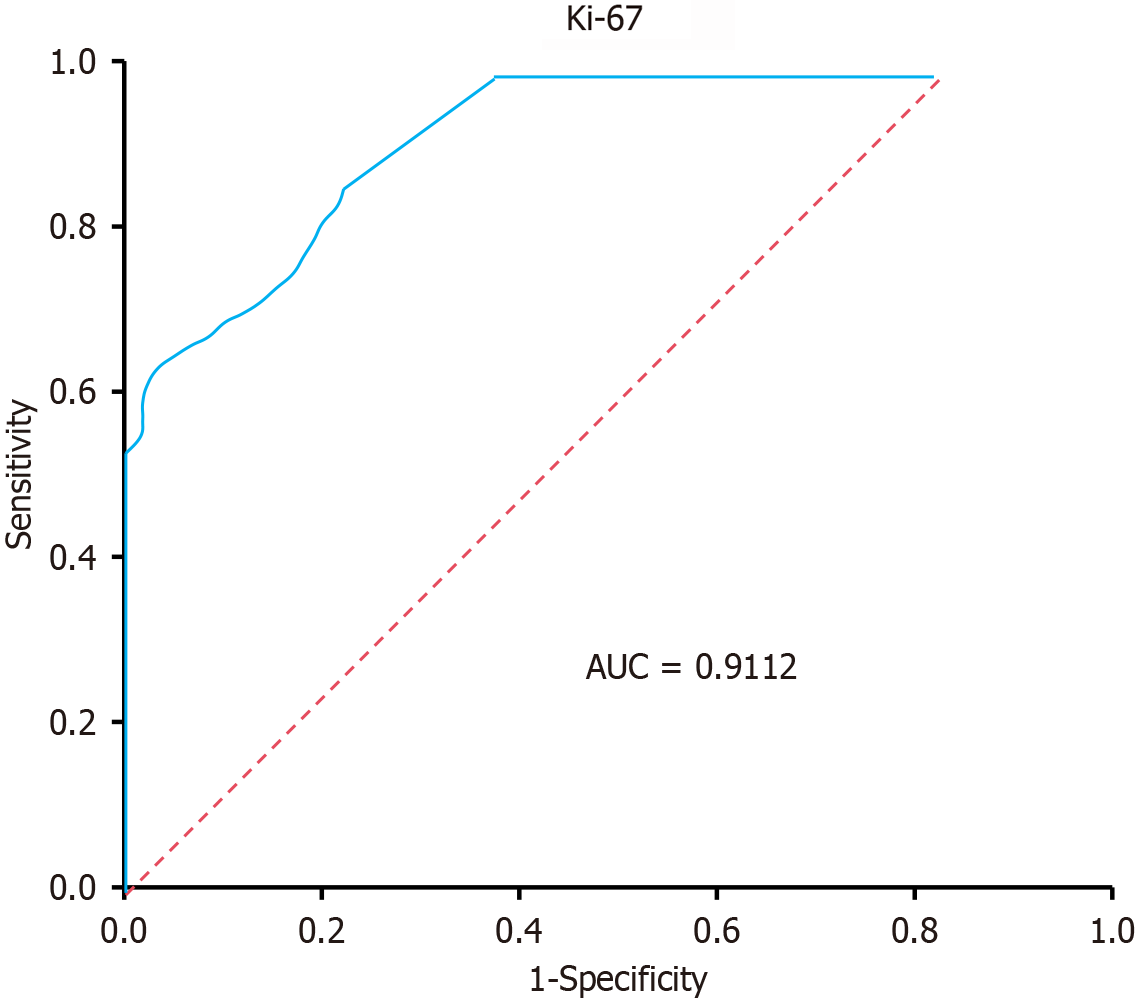
Figure 4 Receiver operating characteristic curve for Ki-67.
The y-axis presents sensitivity (true positive rate), and the x-axis represents 1-specificity (false positive rate). The curve assesses the diagnostic performance of Ki-67, and the area under the receiver operating characteristic (ROC) curve (AUC) is 0.9112, indicating a high level of accuracy. The dotted red line represents a random guess (AUC = 0.5), and the blue ROC curve greatly surpasses this line, illustrating that Ki-67 has strong predictive power in this context. AUC: Area under the receiver operating characteristic curve.
- Citation: Chen K, Wang G, Hu JC, Zhou YY, Ma HT. Clinical significance of Ki-67 in patients with lung adenocarcinoma in situ complicated by type 2 diabetes. World J Diabetes 2025; 16(2): 98423
- URL: https://www.wjgnet.com/1948-9358/full/v16/i2/98423.htm
- DOI: https://dx.doi.org/10.4239/wjd.v16.i2.98423


