Copyright
©The Author(s) 2025.
World J Diabetes. Feb 15, 2025; 16(2): 97287
Published online Feb 15, 2025. doi: 10.4239/wjd.v16.i2.97287
Published online Feb 15, 2025. doi: 10.4239/wjd.v16.i2.97287
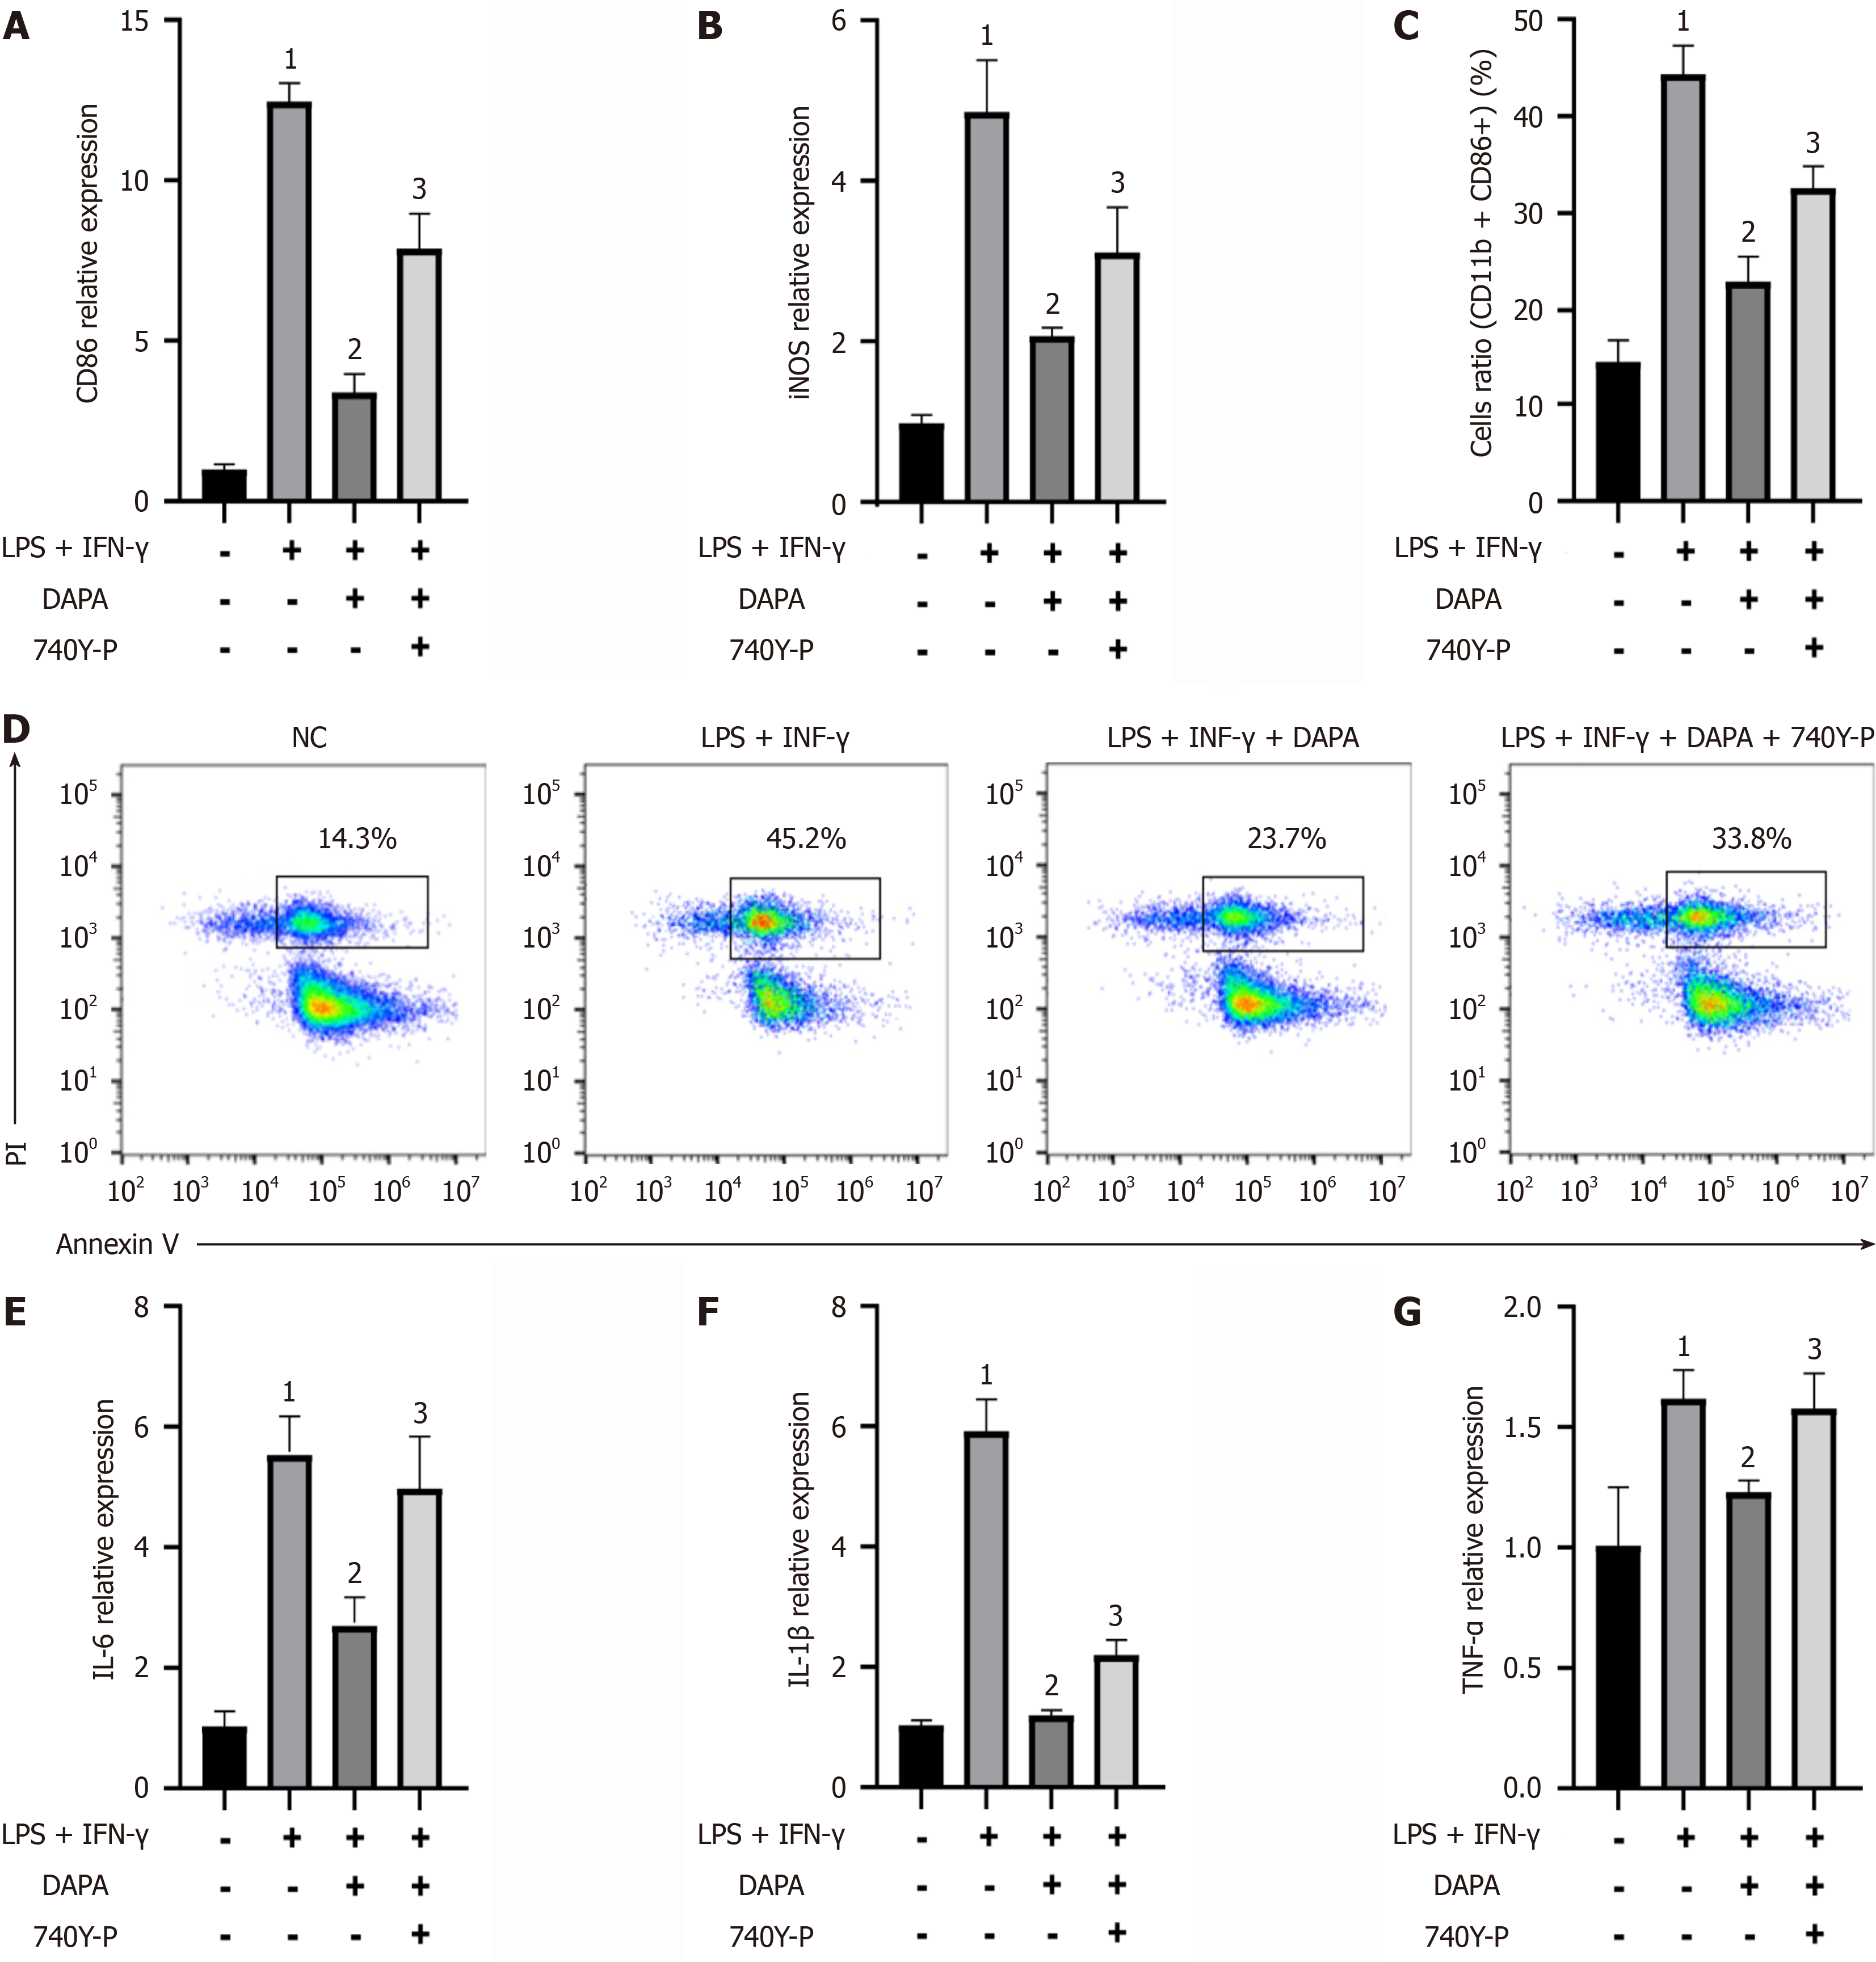
Figure 6 Dapagliflozin reduces human monocyte cell line cell polarization toward the M1 phenotype and decreases the expression levels of inflammatory factors, effects that are inhibited by 740Y-P (a phosphoinositide 3-kinase/protein kinase B signaling pathway agonist).
Relative mRNA expression levels of M1 macrophage surface markers: A: Inducible nitric oxide synthase; B: Cluster of differentiation 86; Expression ratio of M1 macrophages: C: Cluster of differentiation 11b + detected by flow cytometry; D: Cluster of differentiation 86+ detected by flow cytometry; Relative mRNA expression levels of inflammatory factors: E: Interleukin-6; F: Interleukin-1β; G: Tumor necrosis factor-α. The bars indicate the mean ± SD from three independent experiments (n = 3). 1P < 0.05 vs normal control group; 2P < 0.05 vs lipopolysaccharides + interferon-γ; 3P < 0.05 vs lipopolysaccharides + interferon-γ + dapagliflozin. NC: Normal control group; LPS: Lipopolysaccharides; IFN-γ: Interferon-γ; 740Y-P: A PI3K/AKT signaling pathway agonist; PI: Propidium iodide; DAPA: Type 2 diabetic mouse group treated with dapagliflozin; IL: Interleukin; TNF: Tumor necrosis factor; CD: Cluster of differentiation; iNOS: Inducible nitric oxide synthase.
- Citation: Xiong SX, Huang LJ, Liu HS, Zhang XX, Li M, Cui YB, Shao C, Hu XL. Dapagliflozin exerts anti-apoptotic effects by mitigating macrophage polarization via modulation of the phosphoinositide 3-kinase/protein kinase B signaling pathway. World J Diabetes 2025; 16(2): 97287
- URL: https://www.wjgnet.com/1948-9358/full/v16/i2/97287.htm
- DOI: https://dx.doi.org/10.4239/wjd.v16.i2.97287


