Copyright
©The Author(s) 2025.
World J Diabetes. Feb 15, 2025; 16(2): 97287
Published online Feb 15, 2025. doi: 10.4239/wjd.v16.i2.97287
Published online Feb 15, 2025. doi: 10.4239/wjd.v16.i2.97287
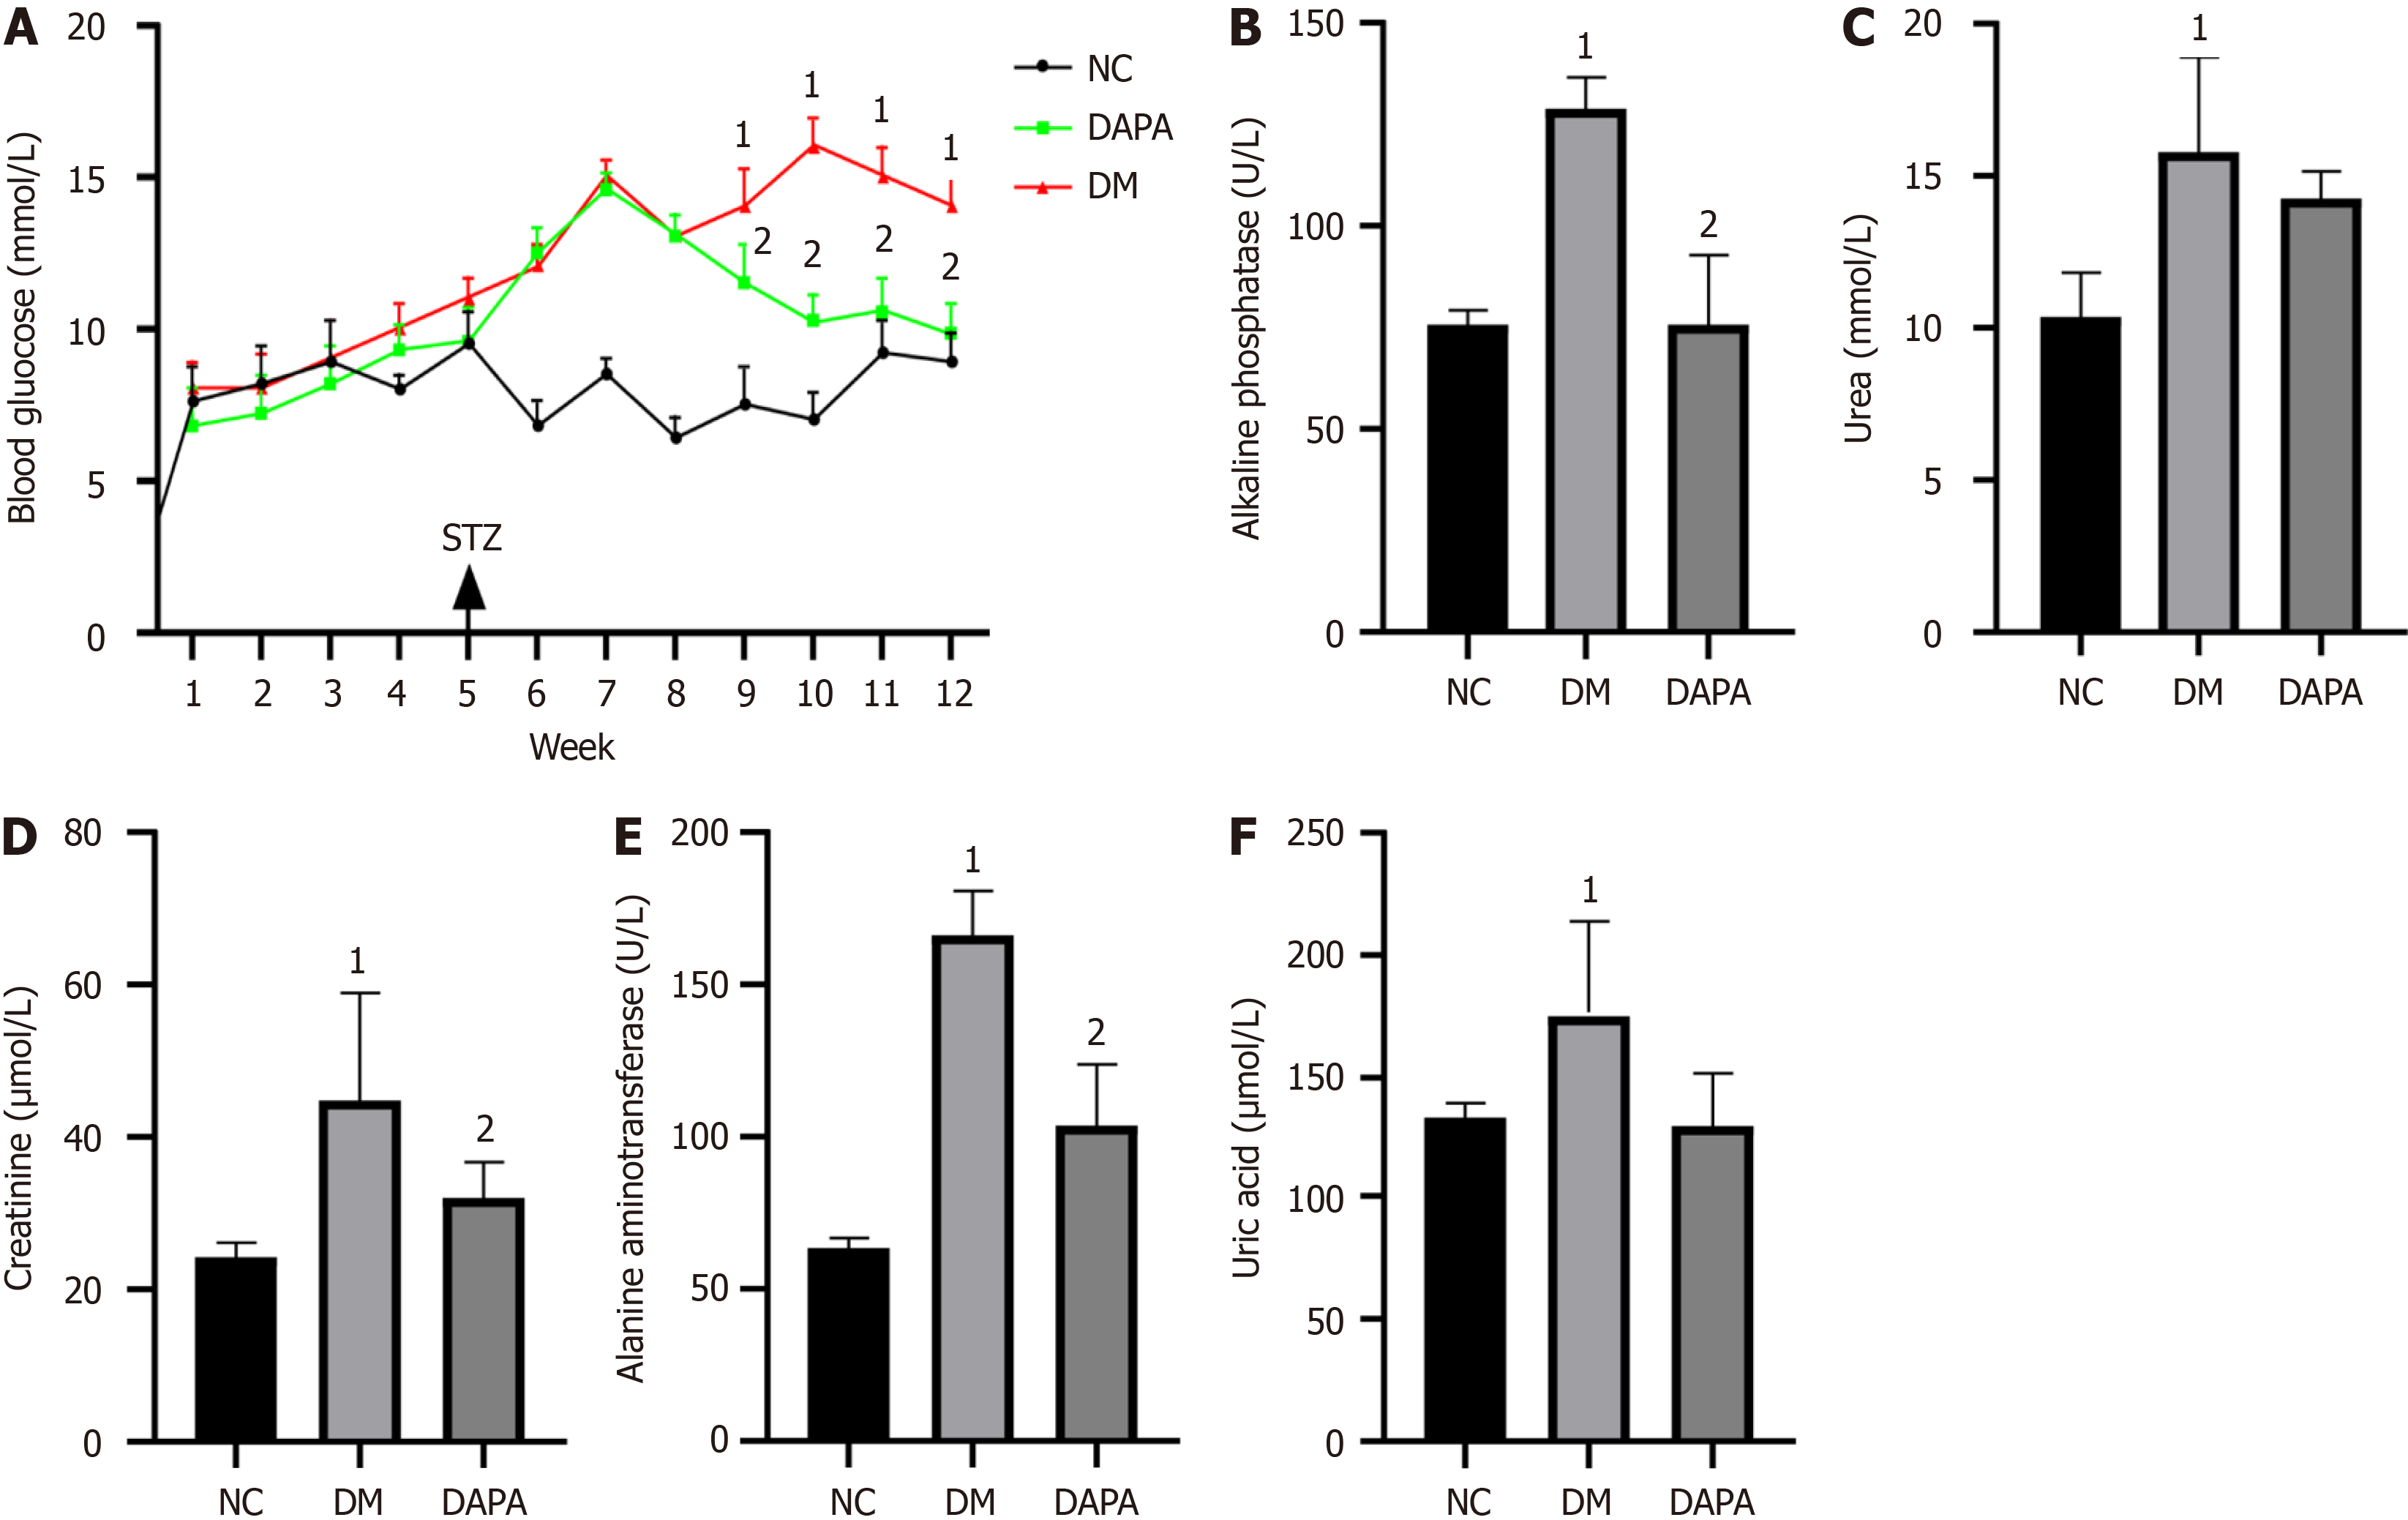
Figure 1 Effects of dapagliflozin treatment on blood glucose and liver and kidney functions in diabetic mice.
A: Dynamic changes in blood glucose in each group of mice; B-F: Serum concentrations of serum alkaline phosphatase, creatinine, alanine aminotransferase, urea and uric acid in mice. The bars indicate the mean ± SD from three independent experiments (n = 3). 1P < 0.05 vs normal control group; 2P < 0.05 vs type 2 diabetic mouse group. NC: Normal control group; DM: Type 2 diabetic mouse group; DAPA: Type 2 diabetic mouse group treated with dapagliflozin; STZ: Streptozotocin.
- Citation: Xiong SX, Huang LJ, Liu HS, Zhang XX, Li M, Cui YB, Shao C, Hu XL. Dapagliflozin exerts anti-apoptotic effects by mitigating macrophage polarization via modulation of the phosphoinositide 3-kinase/protein kinase B signaling pathway. World J Diabetes 2025; 16(2): 97287
- URL: https://www.wjgnet.com/1948-9358/full/v16/i2/97287.htm
- DOI: https://dx.doi.org/10.4239/wjd.v16.i2.97287


