Copyright
©The Author(s) 2025.
World J Diabetes. Feb 15, 2025; 16(2): 97271
Published online Feb 15, 2025. doi: 10.4239/wjd.v16.i2.97271
Published online Feb 15, 2025. doi: 10.4239/wjd.v16.i2.97271
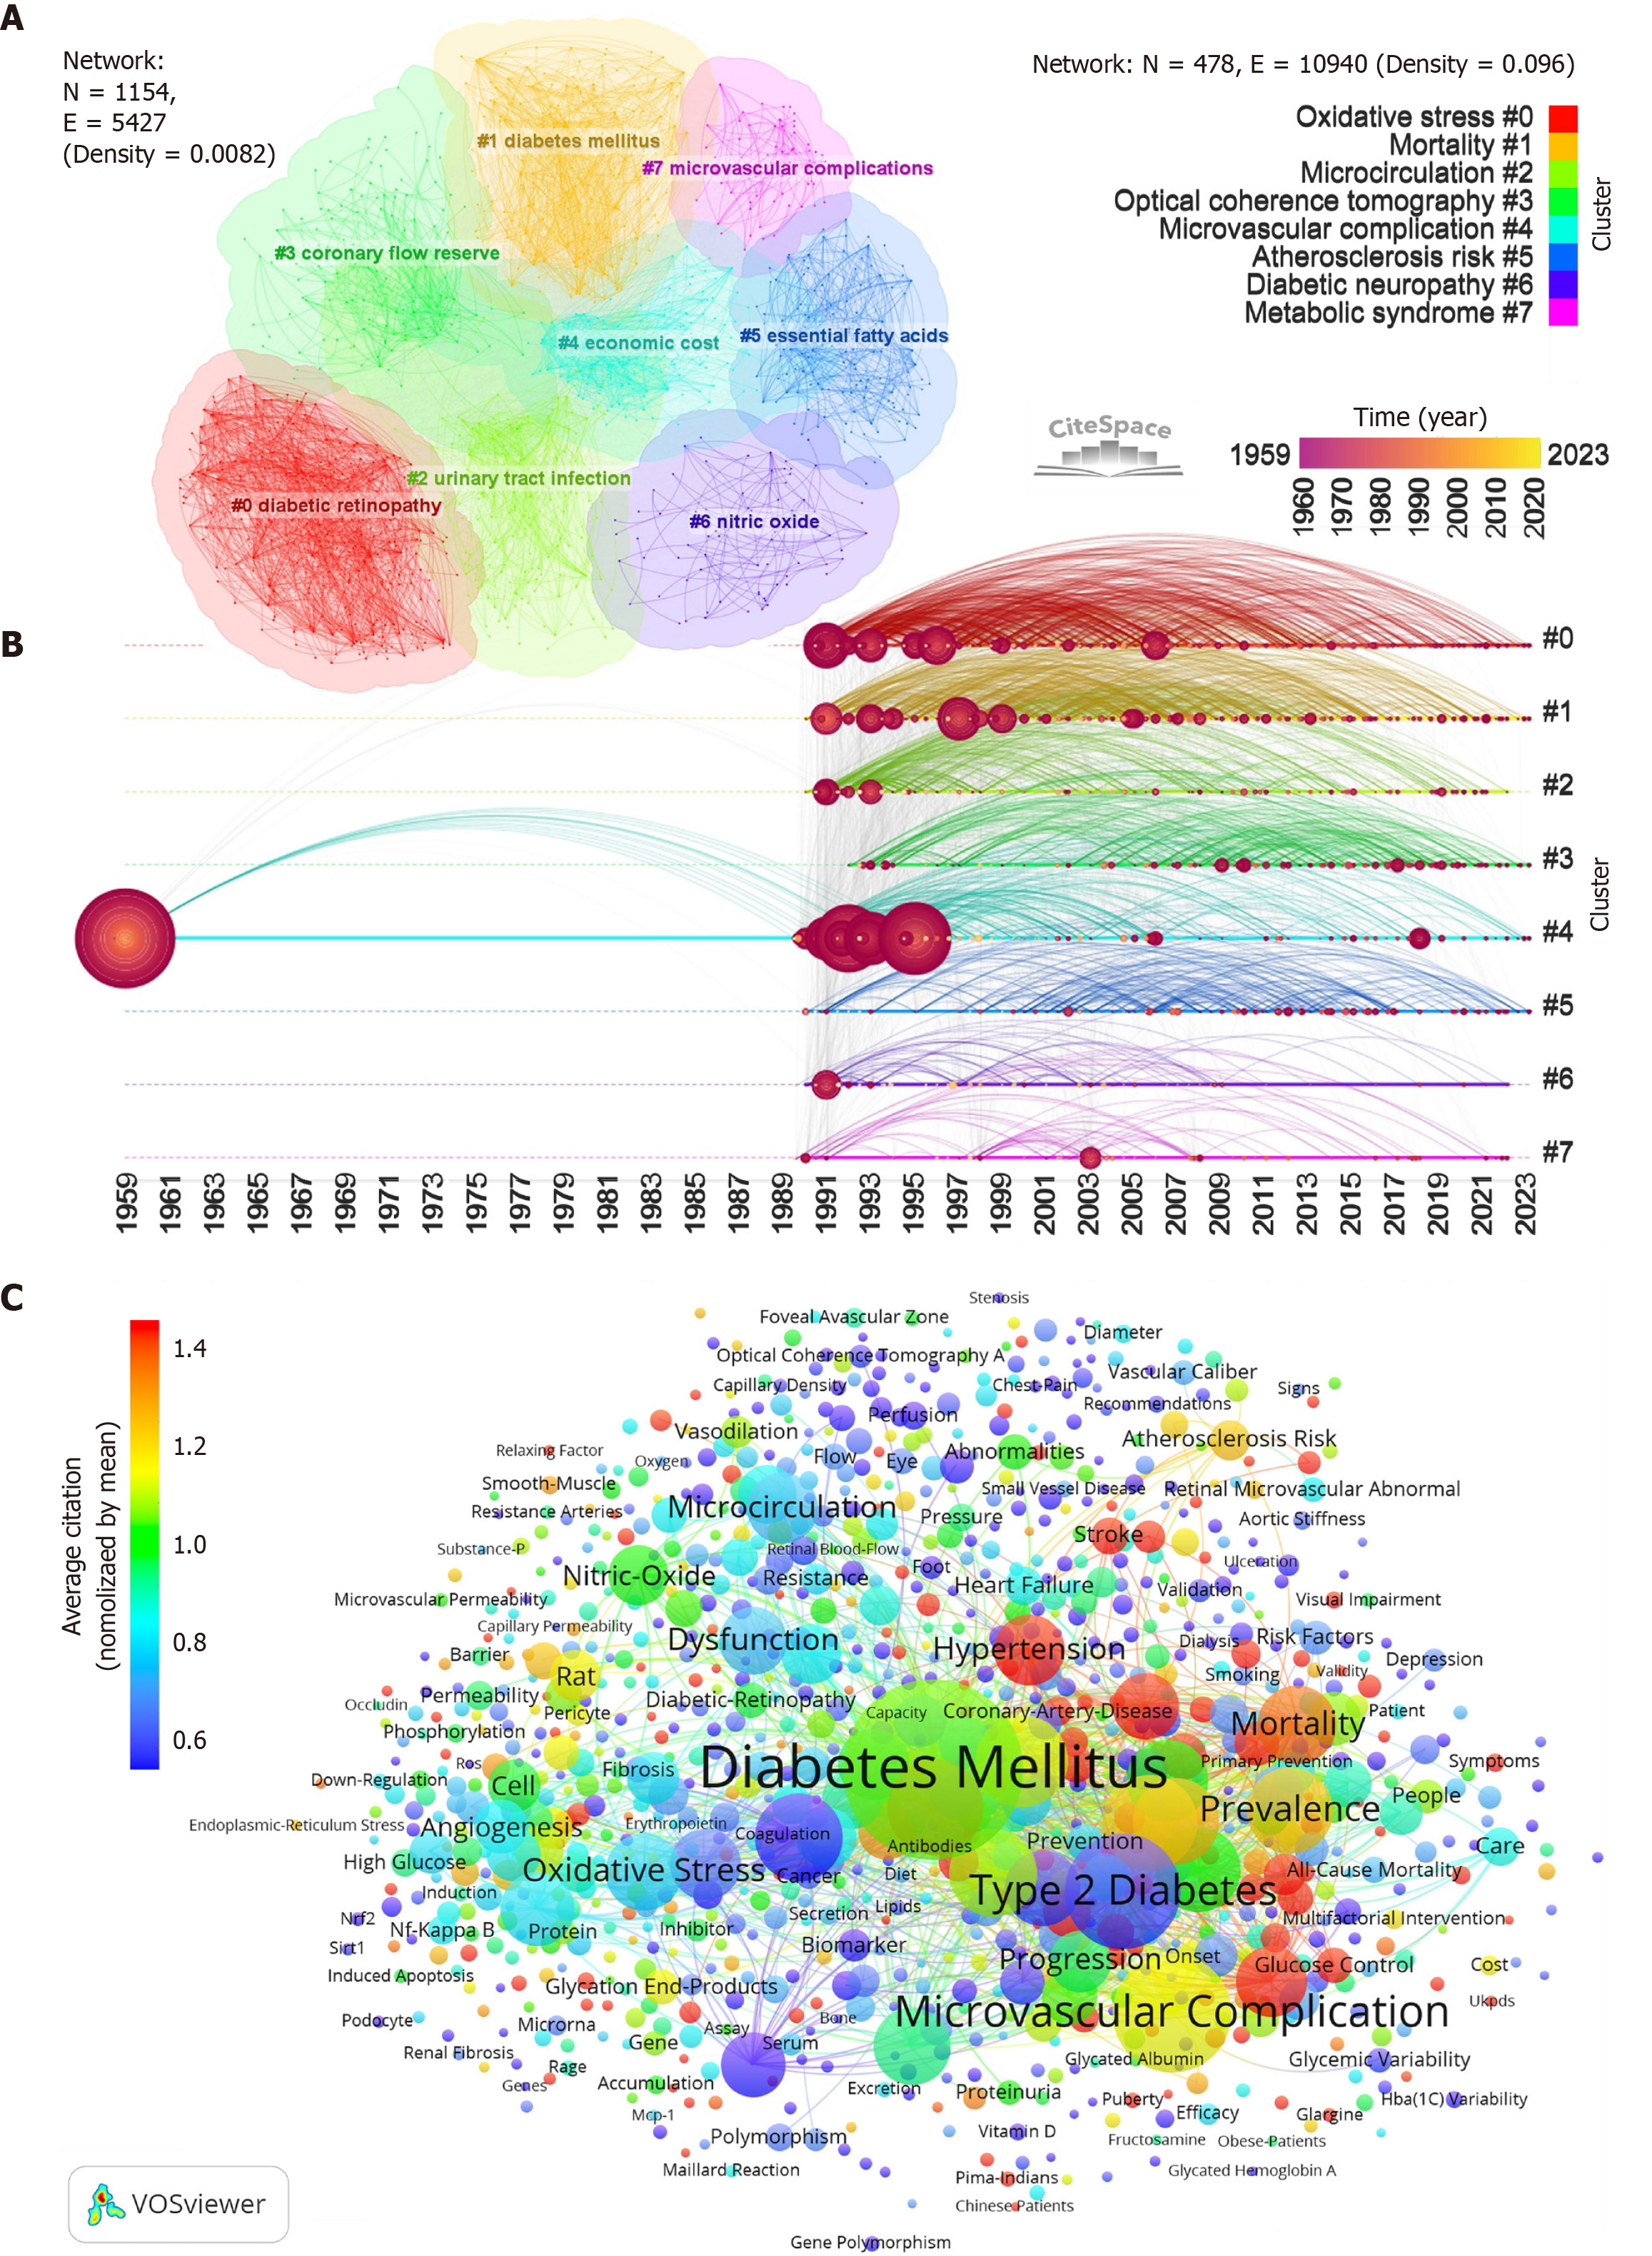
Figure 3 Keyword dynamics and thematic clusters in diabetes-microcirculation research.
A: Panel shows the clustered grouping of these keywords, indicating thematic concentrations in the research; B: Panel presents a timeline of keyword clusters within the field. Circles are color-coded to represent the year each keyword first appeared in the literature, providing a historical perspective on the evolution of research themes. The size of each node indicates the volume of documents associated with that keyword, highlighting the prevalence of specific topics within the field; C: Panel depicts a co-occurrence network of keywords, where the node size reflects the frequency of keyword citation, underscoring the relative prominence of certain terms. The spatial proximity between nodes indicates their co-occurrence in literature, while the thickness of the connecting lines quantifies the strength of these associations. The color of each circle indicates the average citation year of the documents in which the keywords appear, offering insights into the temporal relevance of different topics.
- Citation: Li Y, Wang B, Xu MT, Wang YY, Liu WQ, Fu SJ, Li BW, Ling H, Liu XT, Zhang XY, Li AL, Zhang X, Liu MM. Interdisciplinary perspectives on diabetes and microcirculatory dysfunction: A global bibliometric analysis. World J Diabetes 2025; 16(2): 97271
- URL: https://www.wjgnet.com/1948-9358/full/v16/i2/97271.htm
- DOI: https://dx.doi.org/10.4239/wjd.v16.i2.97271


