Copyright
©The Author(s) 2025.
World J Diabetes. Feb 15, 2025; 16(2): 93130
Published online Feb 15, 2025. doi: 10.4239/wjd.v16.i2.93130
Published online Feb 15, 2025. doi: 10.4239/wjd.v16.i2.93130
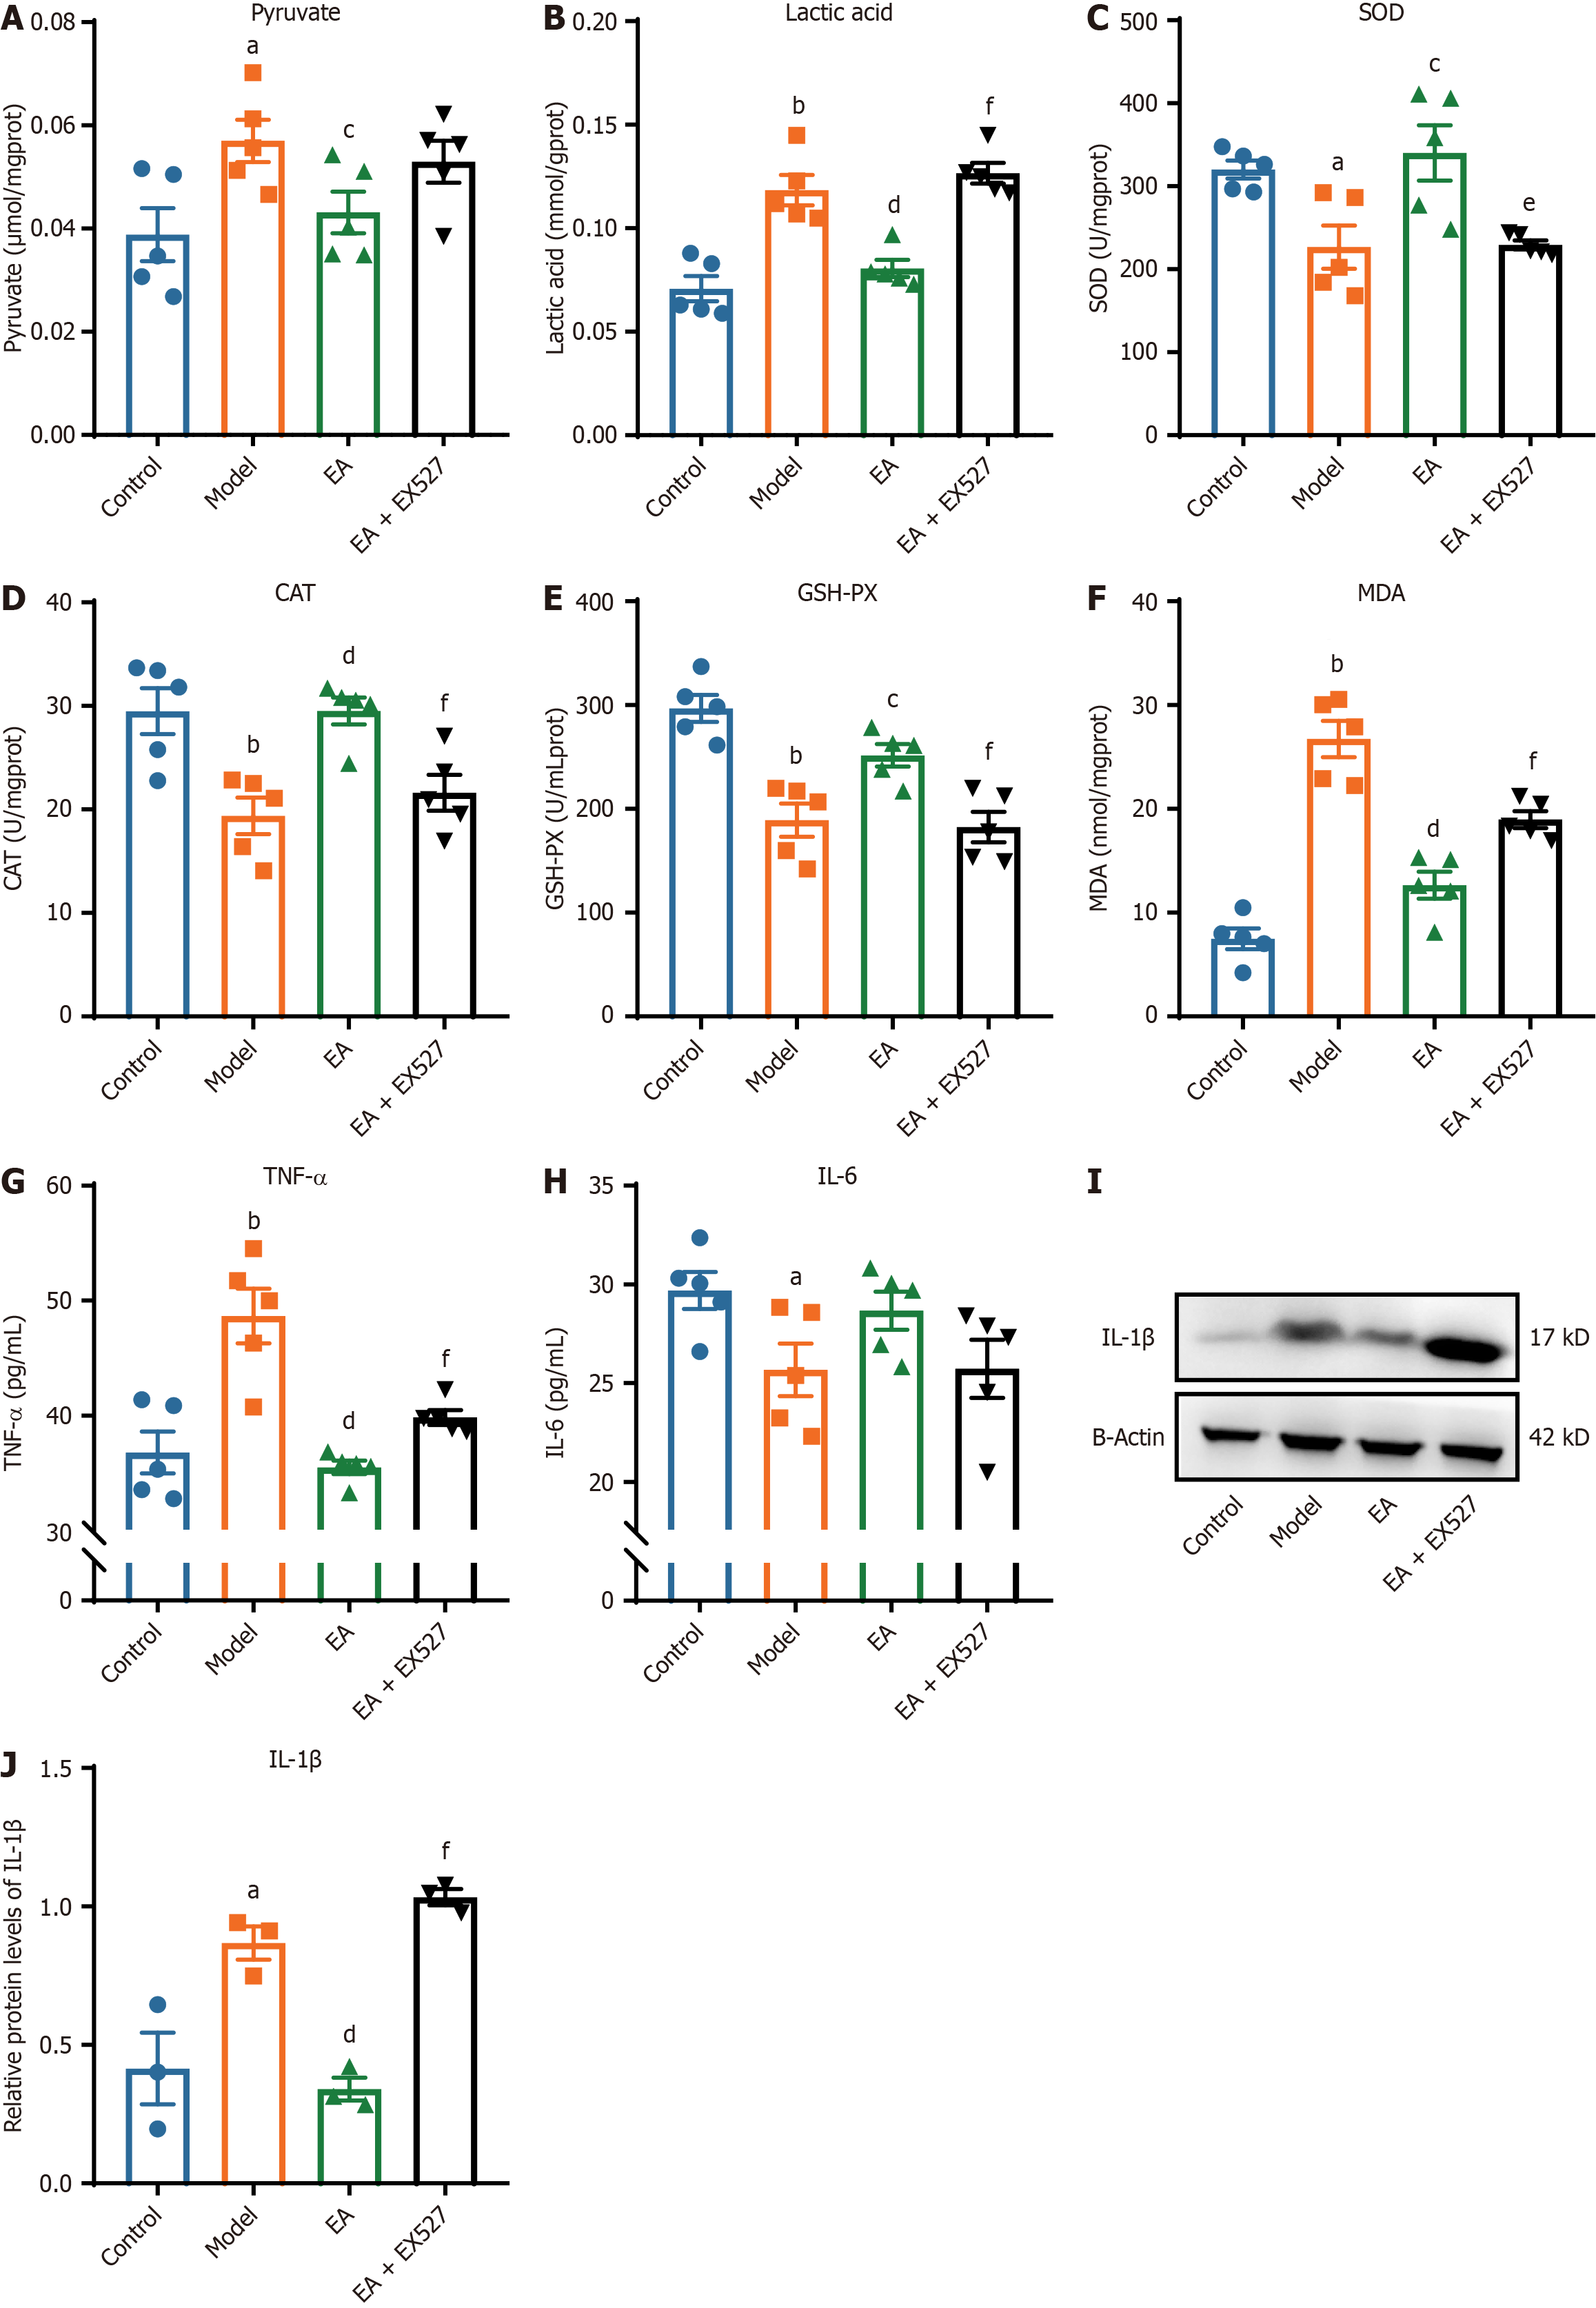
Figure 6 Comparison of pyruvate, lactic acid, oxidative stress, and inflammatory factor-related indicators in sciatic nerve of rats in each group.
A-G: The sciatic nerve of rats in each group (n = 5); A: Pyruvate; B: Lactic acid; C: Superoxide dismutase (SOD); D: Catalase (CAT); E: Glutathione peroxidase (GSH-PX); F: Malondialdehyde (MDA); G: Tumor necrosis factor-alpha (TNF-α); H and I: Protein band (H) and relative expression of interleukin (IL)-1β (I; n = 3); J: IL-6 in the sciatic nerve of rats in each group (n = 5). aP < 0.05, bP < 0.01 vs control group; cP < 0.05, dP < 0.01 vs model group; eP < 0.05, fP < 0.01 vs electroacupuncture (EA) group.
- Citation: Yuan CX, Wang X, Liu Y, Xu TC, Yu Z, Xu B. Electroacupuncture alleviates diabetic peripheral neuropathy through modulating mitochondrial biogenesis and suppressing oxidative stress. World J Diabetes 2025; 16(2): 93130
- URL: https://www.wjgnet.com/1948-9358/full/v16/i2/93130.htm
- DOI: https://dx.doi.org/10.4239/wjd.v16.i2.93130


