Copyright
©The Author(s) 2025.
World J Diabetes. Feb 15, 2025; 16(2): 93130
Published online Feb 15, 2025. doi: 10.4239/wjd.v16.i2.93130
Published online Feb 15, 2025. doi: 10.4239/wjd.v16.i2.93130
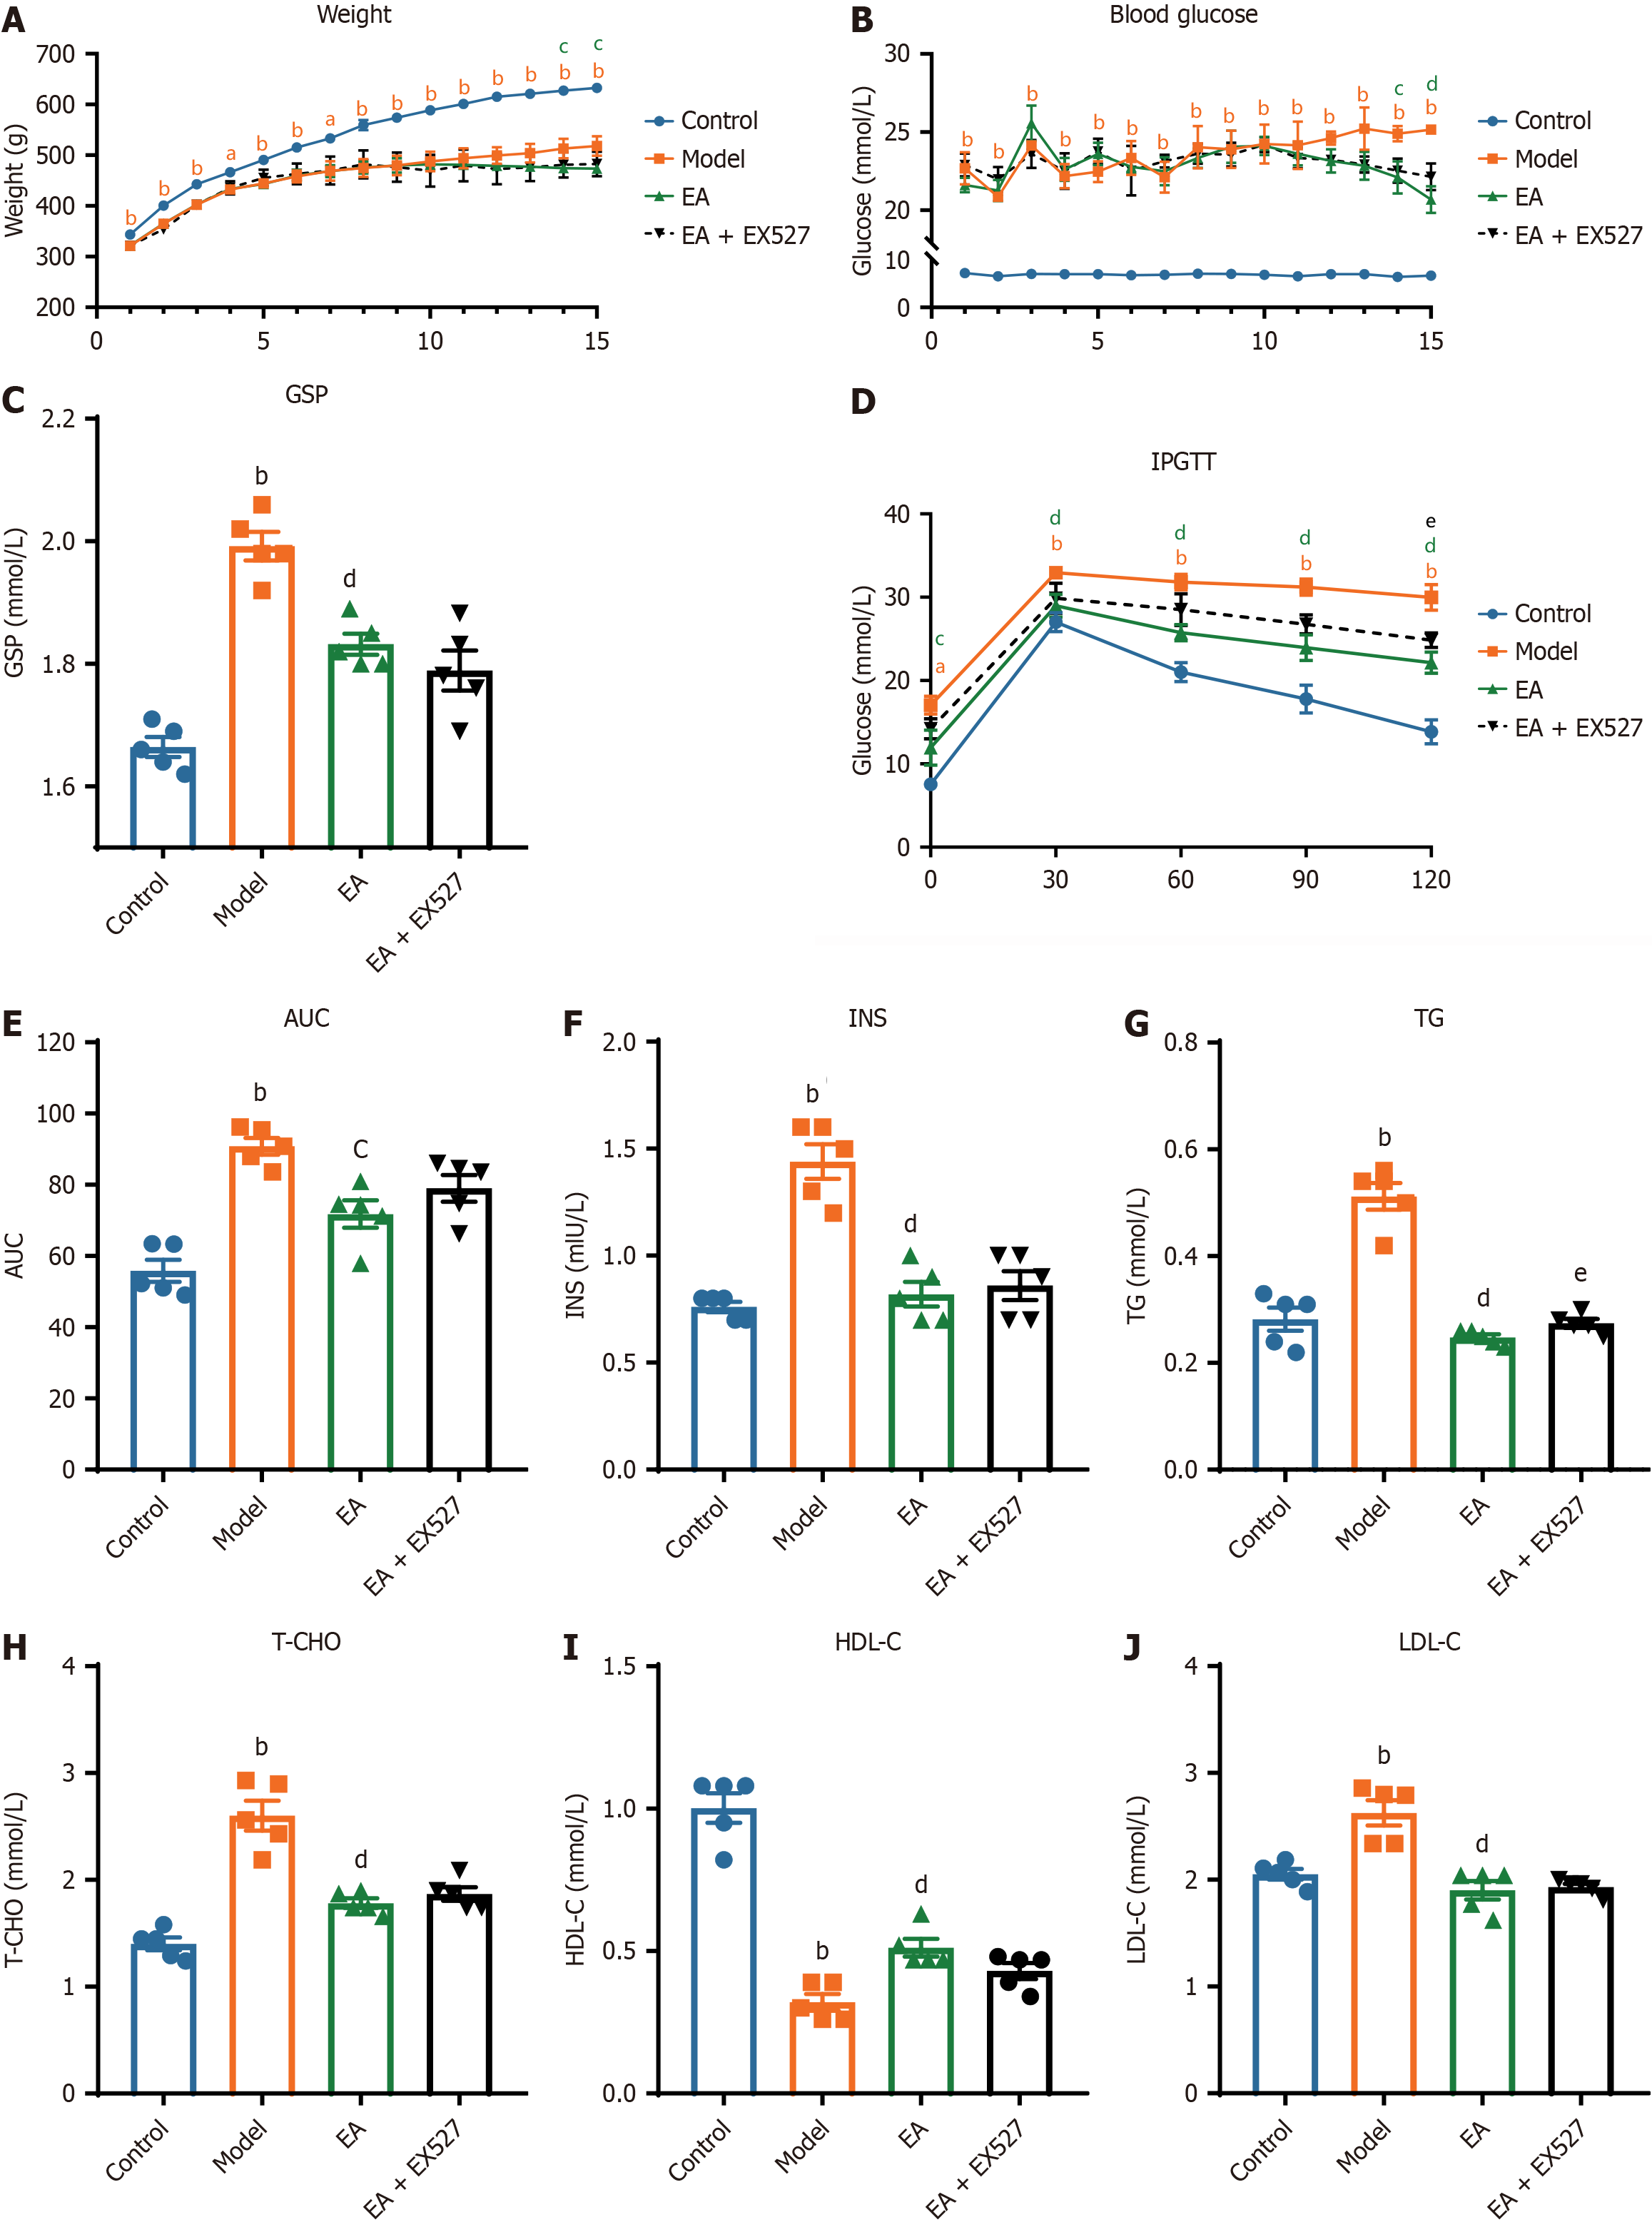
Figure 2 Metabolism index of rats in different groups.
A and B: Weekly changes of random blood glucose (A) and weight (B) in rats after streptozotocin injection; C-J: Evaluations in serum of rats in each group after intervention (n = 5). C: Glycosylated serum protein; D: Intraperitoneal glucose tolerance test (IPGTT); E: Area under the curve (AUC) for the IPGTT test; F: Fasting insulin (INS); G: Triglycerides (TG); H: Total cholesterol (T-CHO); I: High-density lipoprotein level (HDL-C); J: Low-density lipoprotein (LDL-C). aP < 0.05, bP < 0.01 model group vs control group; cP < 0.05, dP < 0.01 electroacupuncture (EA) group vs model group; eP < 0.05 EA + EX527 group vs EA group. GSP: Glycated serum protein.
- Citation: Yuan CX, Wang X, Liu Y, Xu TC, Yu Z, Xu B. Electroacupuncture alleviates diabetic peripheral neuropathy through modulating mitochondrial biogenesis and suppressing oxidative stress. World J Diabetes 2025; 16(2): 93130
- URL: https://www.wjgnet.com/1948-9358/full/v16/i2/93130.htm
- DOI: https://dx.doi.org/10.4239/wjd.v16.i2.93130


