Copyright
©The Author(s) 2025.
World J Diabetes. Feb 15, 2025; 16(2): 101538
Published online Feb 15, 2025. doi: 10.4239/wjd.v16.i2.101538
Published online Feb 15, 2025. doi: 10.4239/wjd.v16.i2.101538
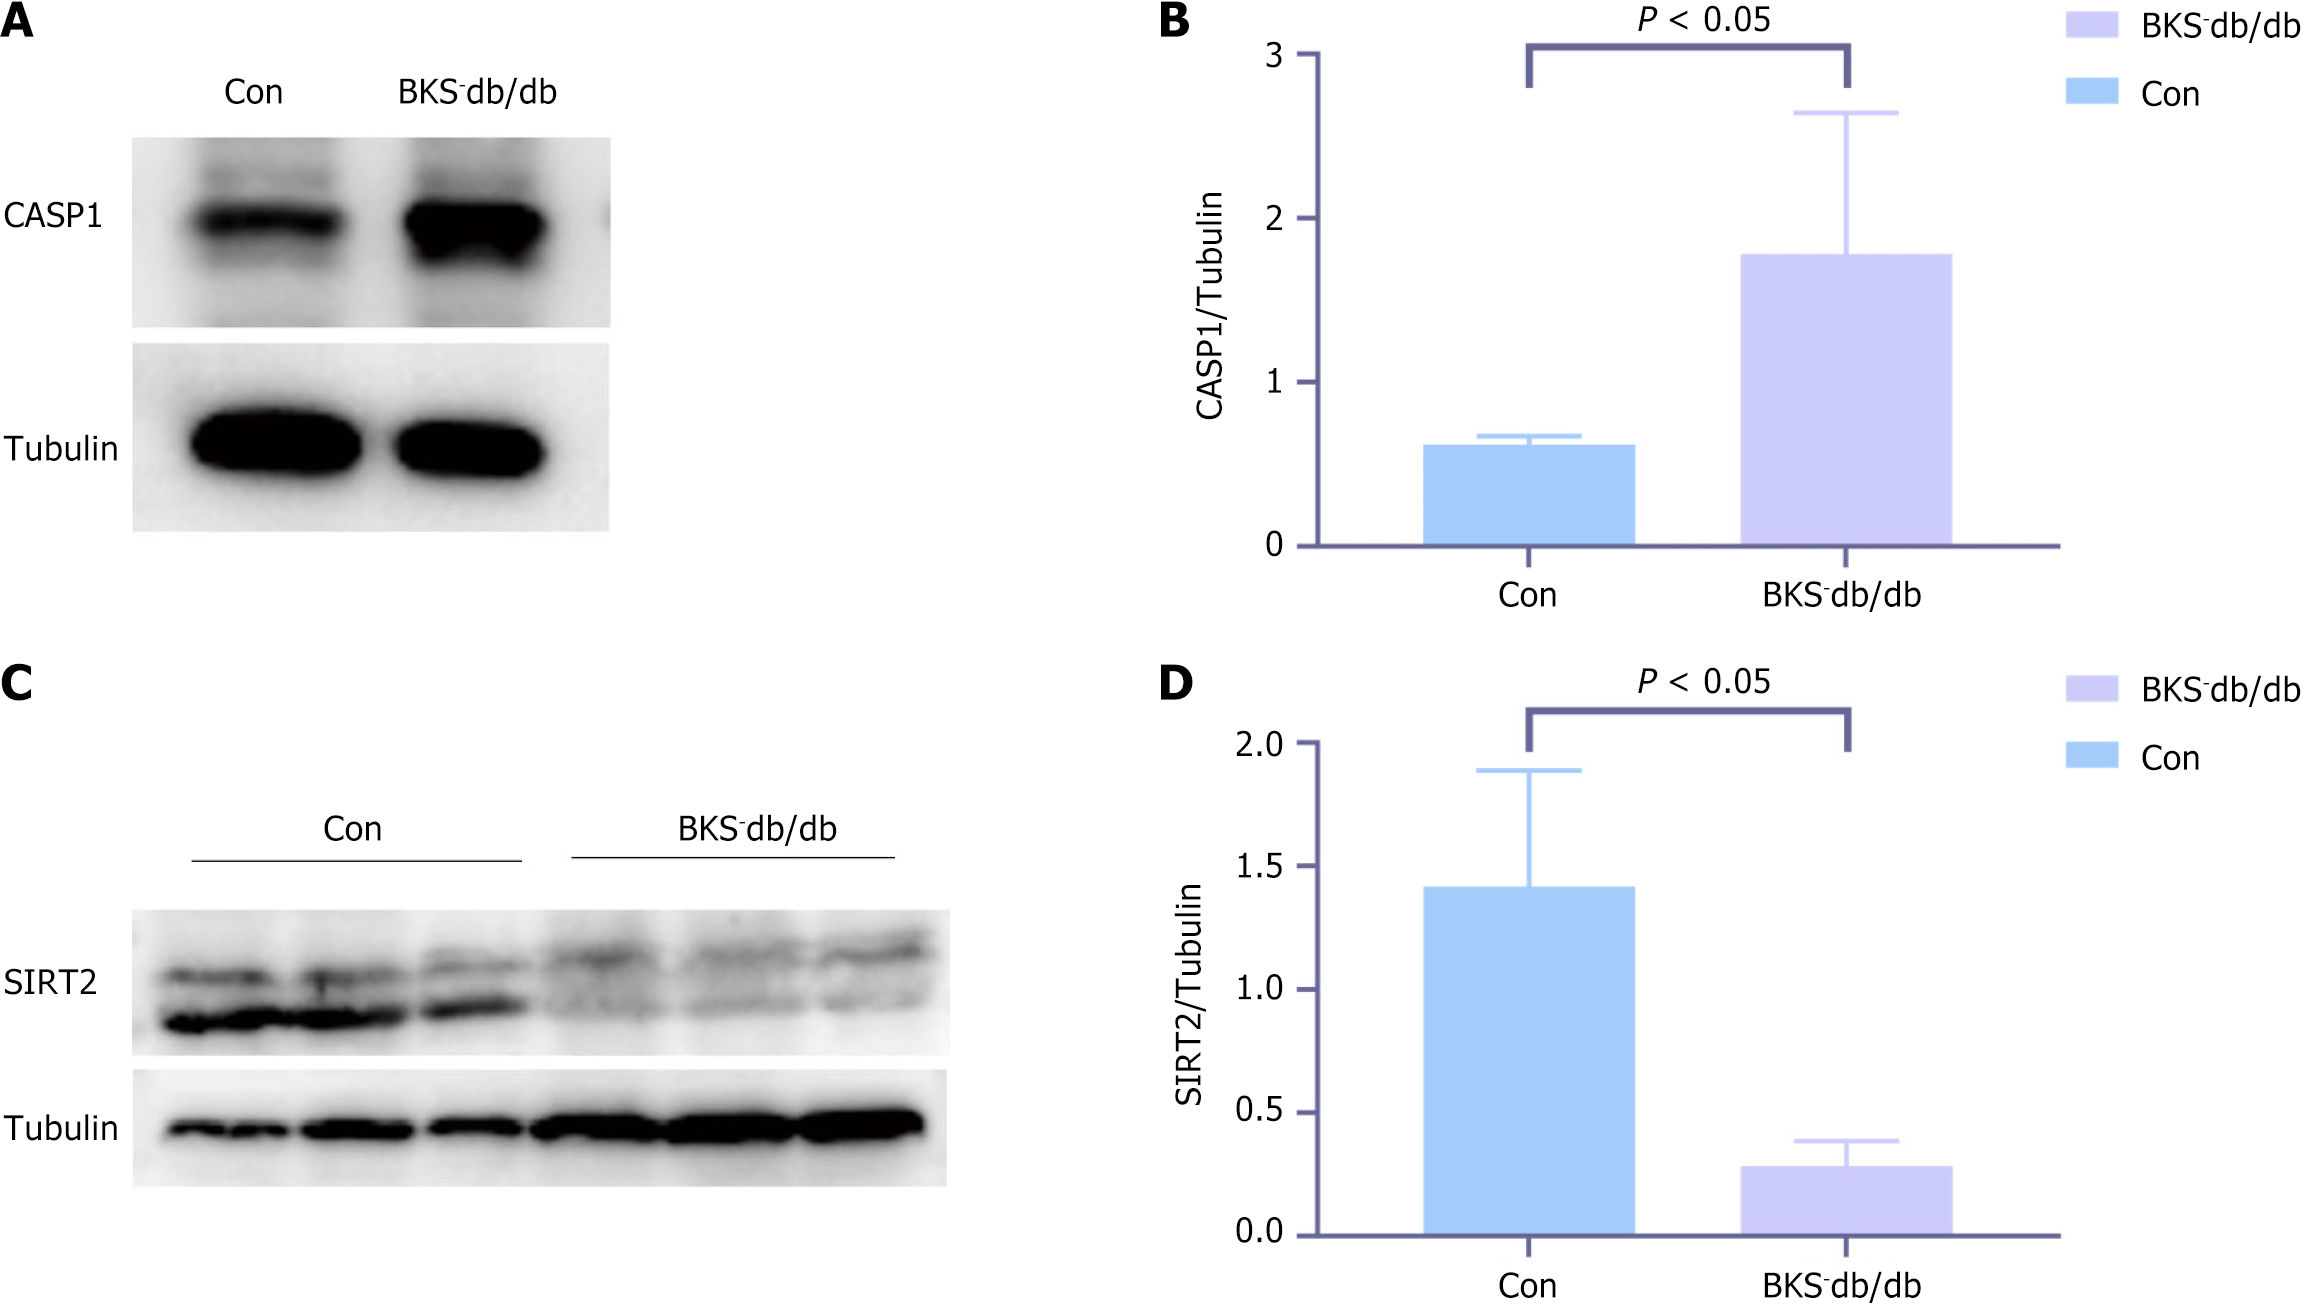
Figure 7 Validation of high caspase 1 and low sirtuin 2 expressions in diabetic kidney disease models.
A and B: Western blot staining of caspase 1 between the diabetic kidney disease and control groups; C and D: Western blot staining of sirtuin 2 between the diabetic kidney disease and control groups (n = 4). CASP1: Caspase 1; SIRT2: Sirtuin 2.
- Citation: Zhou Y, Fang X, Huang LJ, Wu PW. Transcriptome and single-cell profiling of the mechanism of diabetic kidney disease. World J Diabetes 2025; 16(2): 101538
- URL: https://www.wjgnet.com/1948-9358/full/v16/i2/101538.htm
- DOI: https://dx.doi.org/10.4239/wjd.v16.i2.101538


