Copyright
©The Author(s) 2025.
World J Diabetes. Feb 15, 2025; 16(2): 101538
Published online Feb 15, 2025. doi: 10.4239/wjd.v16.i2.101538
Published online Feb 15, 2025. doi: 10.4239/wjd.v16.i2.101538
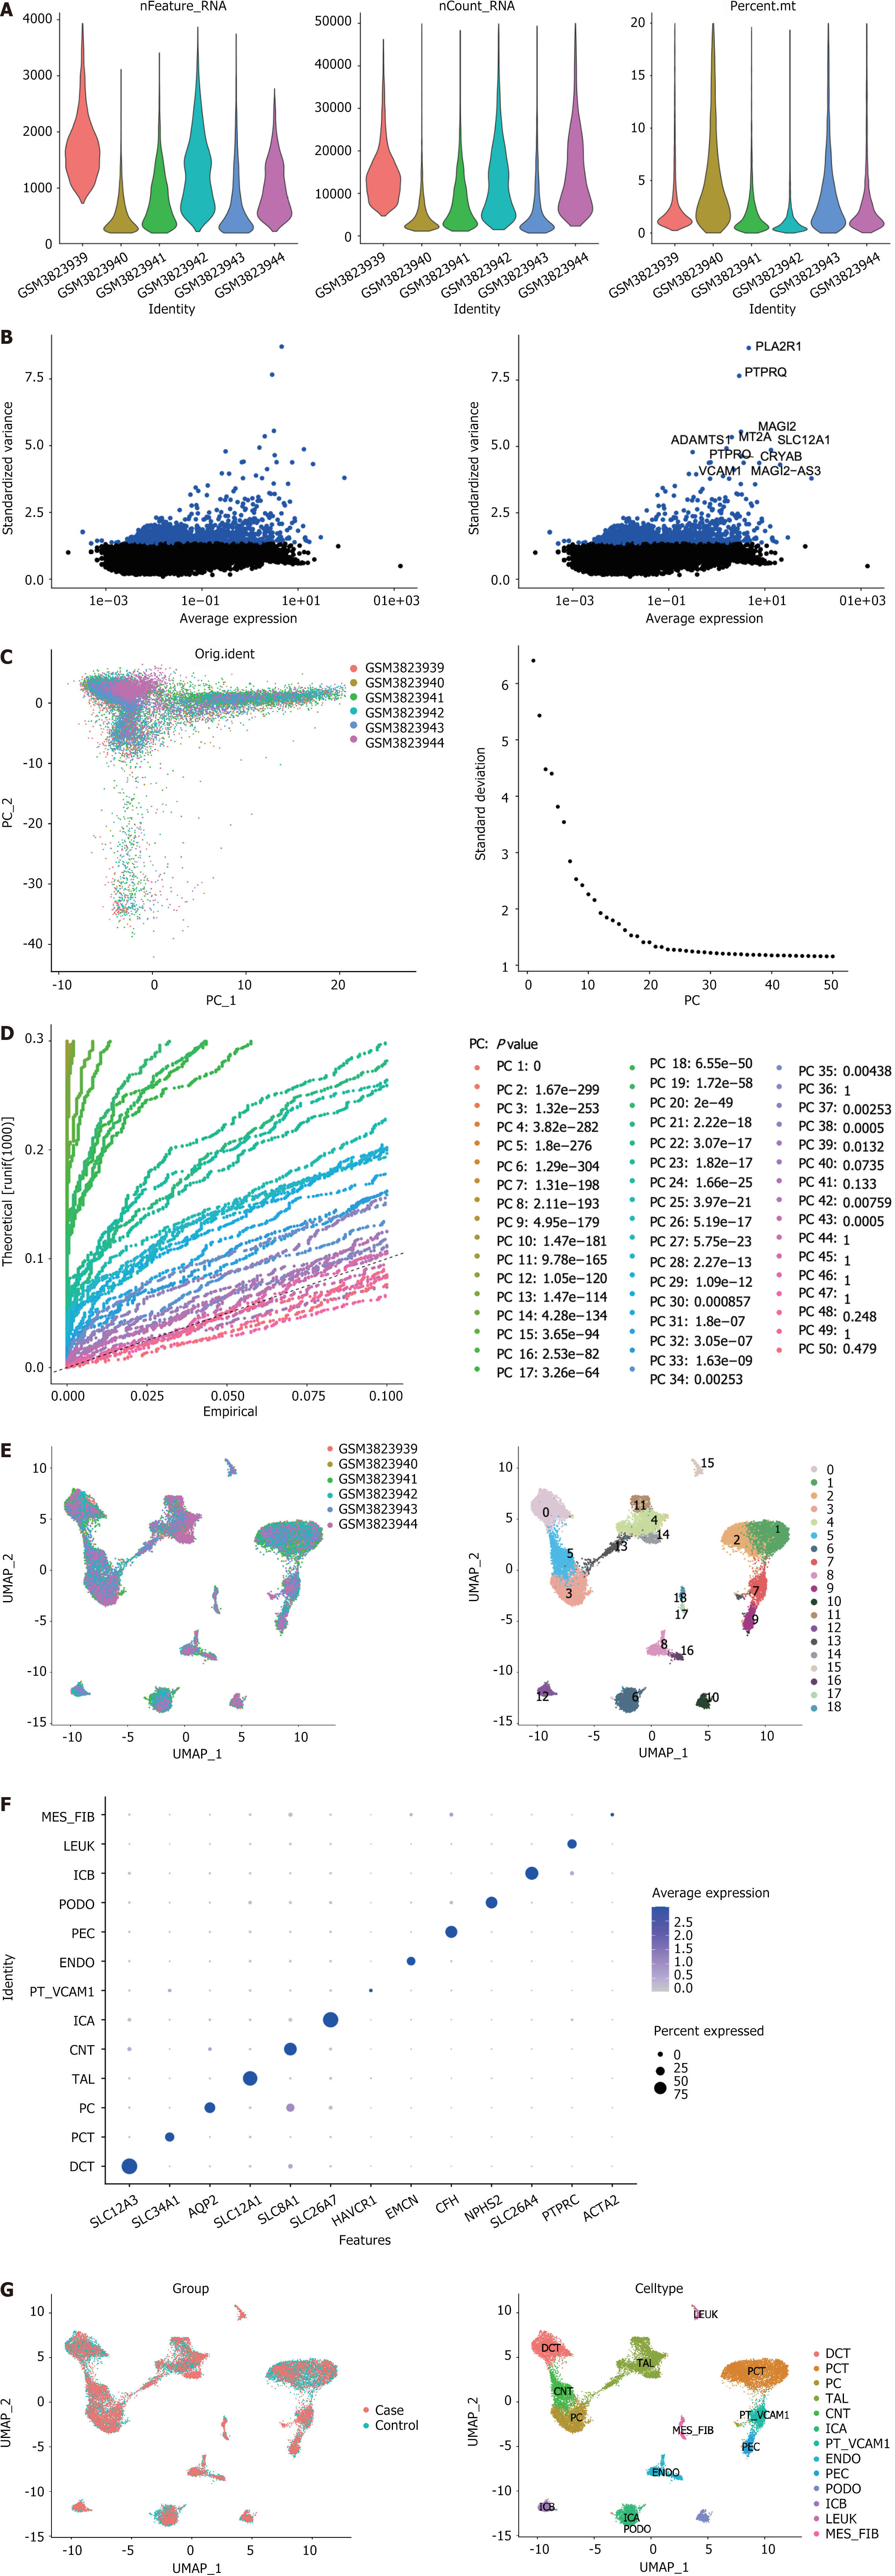
Figure 5 The 13 cells were annotated by single-cell analysis.
A: After quality control, the remaining cells and genes were identified; B: Variance diagram showing variation in gene expression in all cells. Blue dots represent highly variable genes, and black dots represent non-variable genes; C: Principal component analysis exhibited no outliers; D: Principal component analysis identified the top 30 principal components at P < 0.05; E: The uniform manifold approximation and projection algorithm was applied to the top 30 principal components for dimensionality reduction, and 19 cell clusters were successfully classified; F: Expression levels of marker genes in each cell cluster; G: All 13 cell clusters were annotated using singleR and CellMarker based on the composition of marker genes. UMAP: Uniform manifold approximation and projection; MES_FIB: Mesenchymal fibroblast; LEUK: Leukocytes; ICB: Type B intercalated cells; PODO: Podocyte; PEC: Parietal epithelial cells; ENDO: Endothelial cells; PT_VACM1: Proximal tubule with vascular cell adhesion molecule-1 expression; ICA: Type A intercalated cells; CNT: Connecting tubule; TAL: Thick ascending limb; PC: Principal cells; PCT: Proximal convoluted tubule; DCT: Distal convoluted tubule.
- Citation: Zhou Y, Fang X, Huang LJ, Wu PW. Transcriptome and single-cell profiling of the mechanism of diabetic kidney disease. World J Diabetes 2025; 16(2): 101538
- URL: https://www.wjgnet.com/1948-9358/full/v16/i2/101538.htm
- DOI: https://dx.doi.org/10.4239/wjd.v16.i2.101538


