Copyright
©The Author(s) 2025.
World J Diabetes. Feb 15, 2025; 16(2): 101538
Published online Feb 15, 2025. doi: 10.4239/wjd.v16.i2.101538
Published online Feb 15, 2025. doi: 10.4239/wjd.v16.i2.101538
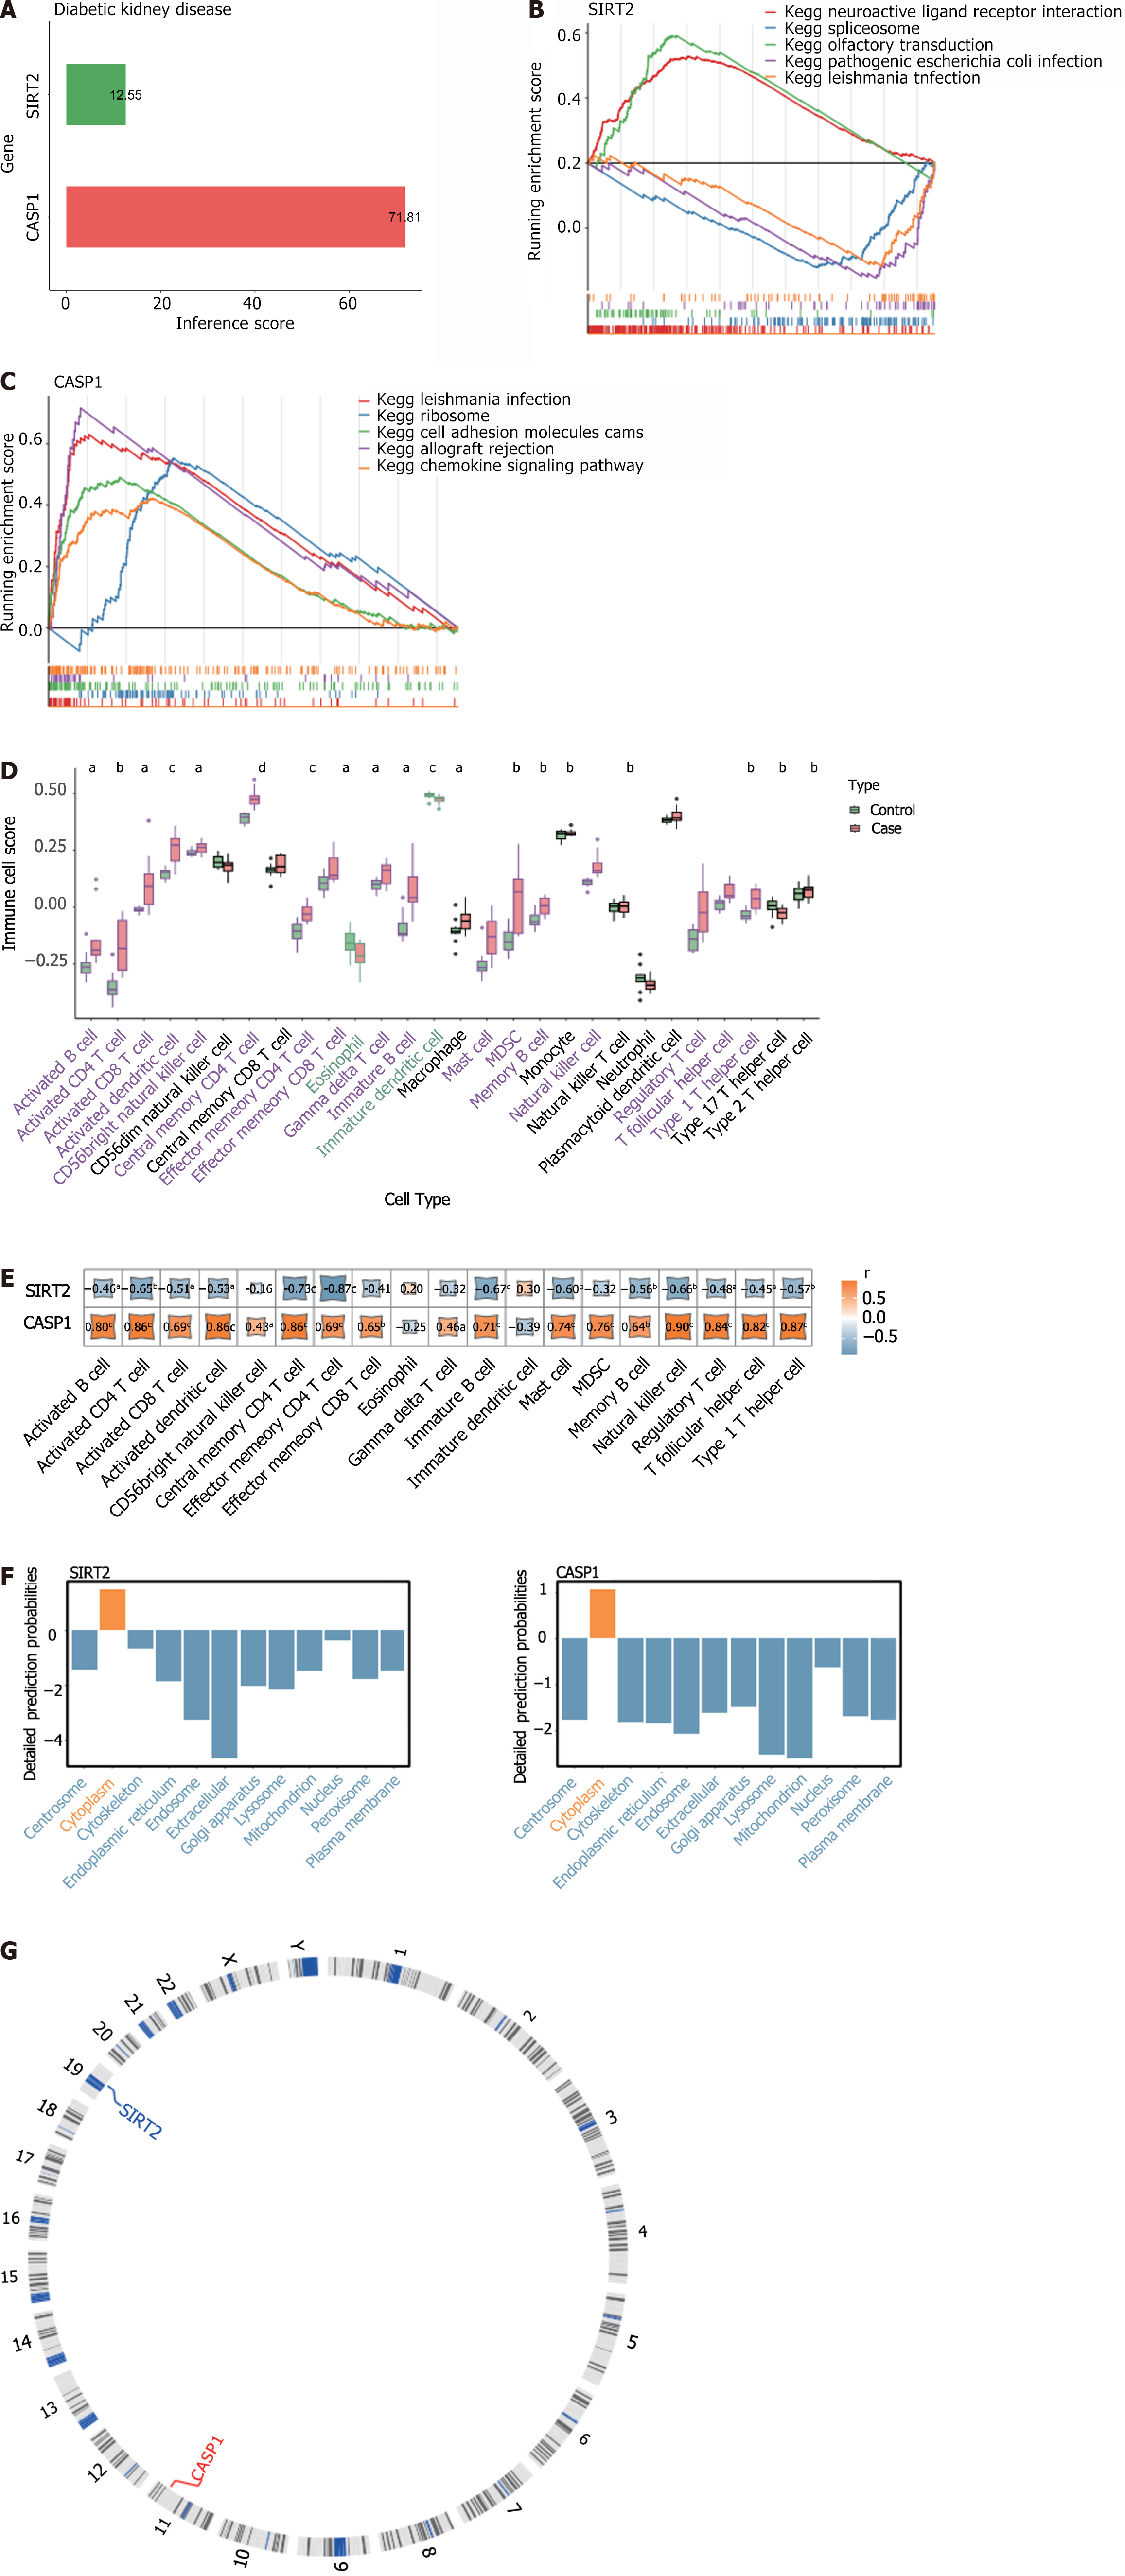
Figure 3 The relationship between biomarkers and diabetic kidney disease.
A: The relationship between biomarkers and diabetic kidney disease; B and C: Representative pathways enriched in the identified genes, as determined by gene set enrichment analysis (normal P < 0.05); D: Enrichment scores of differentially expressed immune cells between the two groups; E: Corrgrams showing the correlations between biomarkers and differential immune cells based on Pearson’s r values; F: Subcellular localization analysis of biomarkers; G: Chromosomal distribution of biomarkers. aP < 0.05; bP < 0.01; cP < 0.001; dP < 0.0001. KEGG: Kyoto Encyclopedia of Genes and Genomes; SIRT2: Sirtuin 2; CASP1: Caspase 1.
- Citation: Zhou Y, Fang X, Huang LJ, Wu PW. Transcriptome and single-cell profiling of the mechanism of diabetic kidney disease. World J Diabetes 2025; 16(2): 101538
- URL: https://www.wjgnet.com/1948-9358/full/v16/i2/101538.htm
- DOI: https://dx.doi.org/10.4239/wjd.v16.i2.101538


