Copyright
©The Author(s) 2025.
World J Diabetes. Feb 15, 2025; 16(2): 101538
Published online Feb 15, 2025. doi: 10.4239/wjd.v16.i2.101538
Published online Feb 15, 2025. doi: 10.4239/wjd.v16.i2.101538
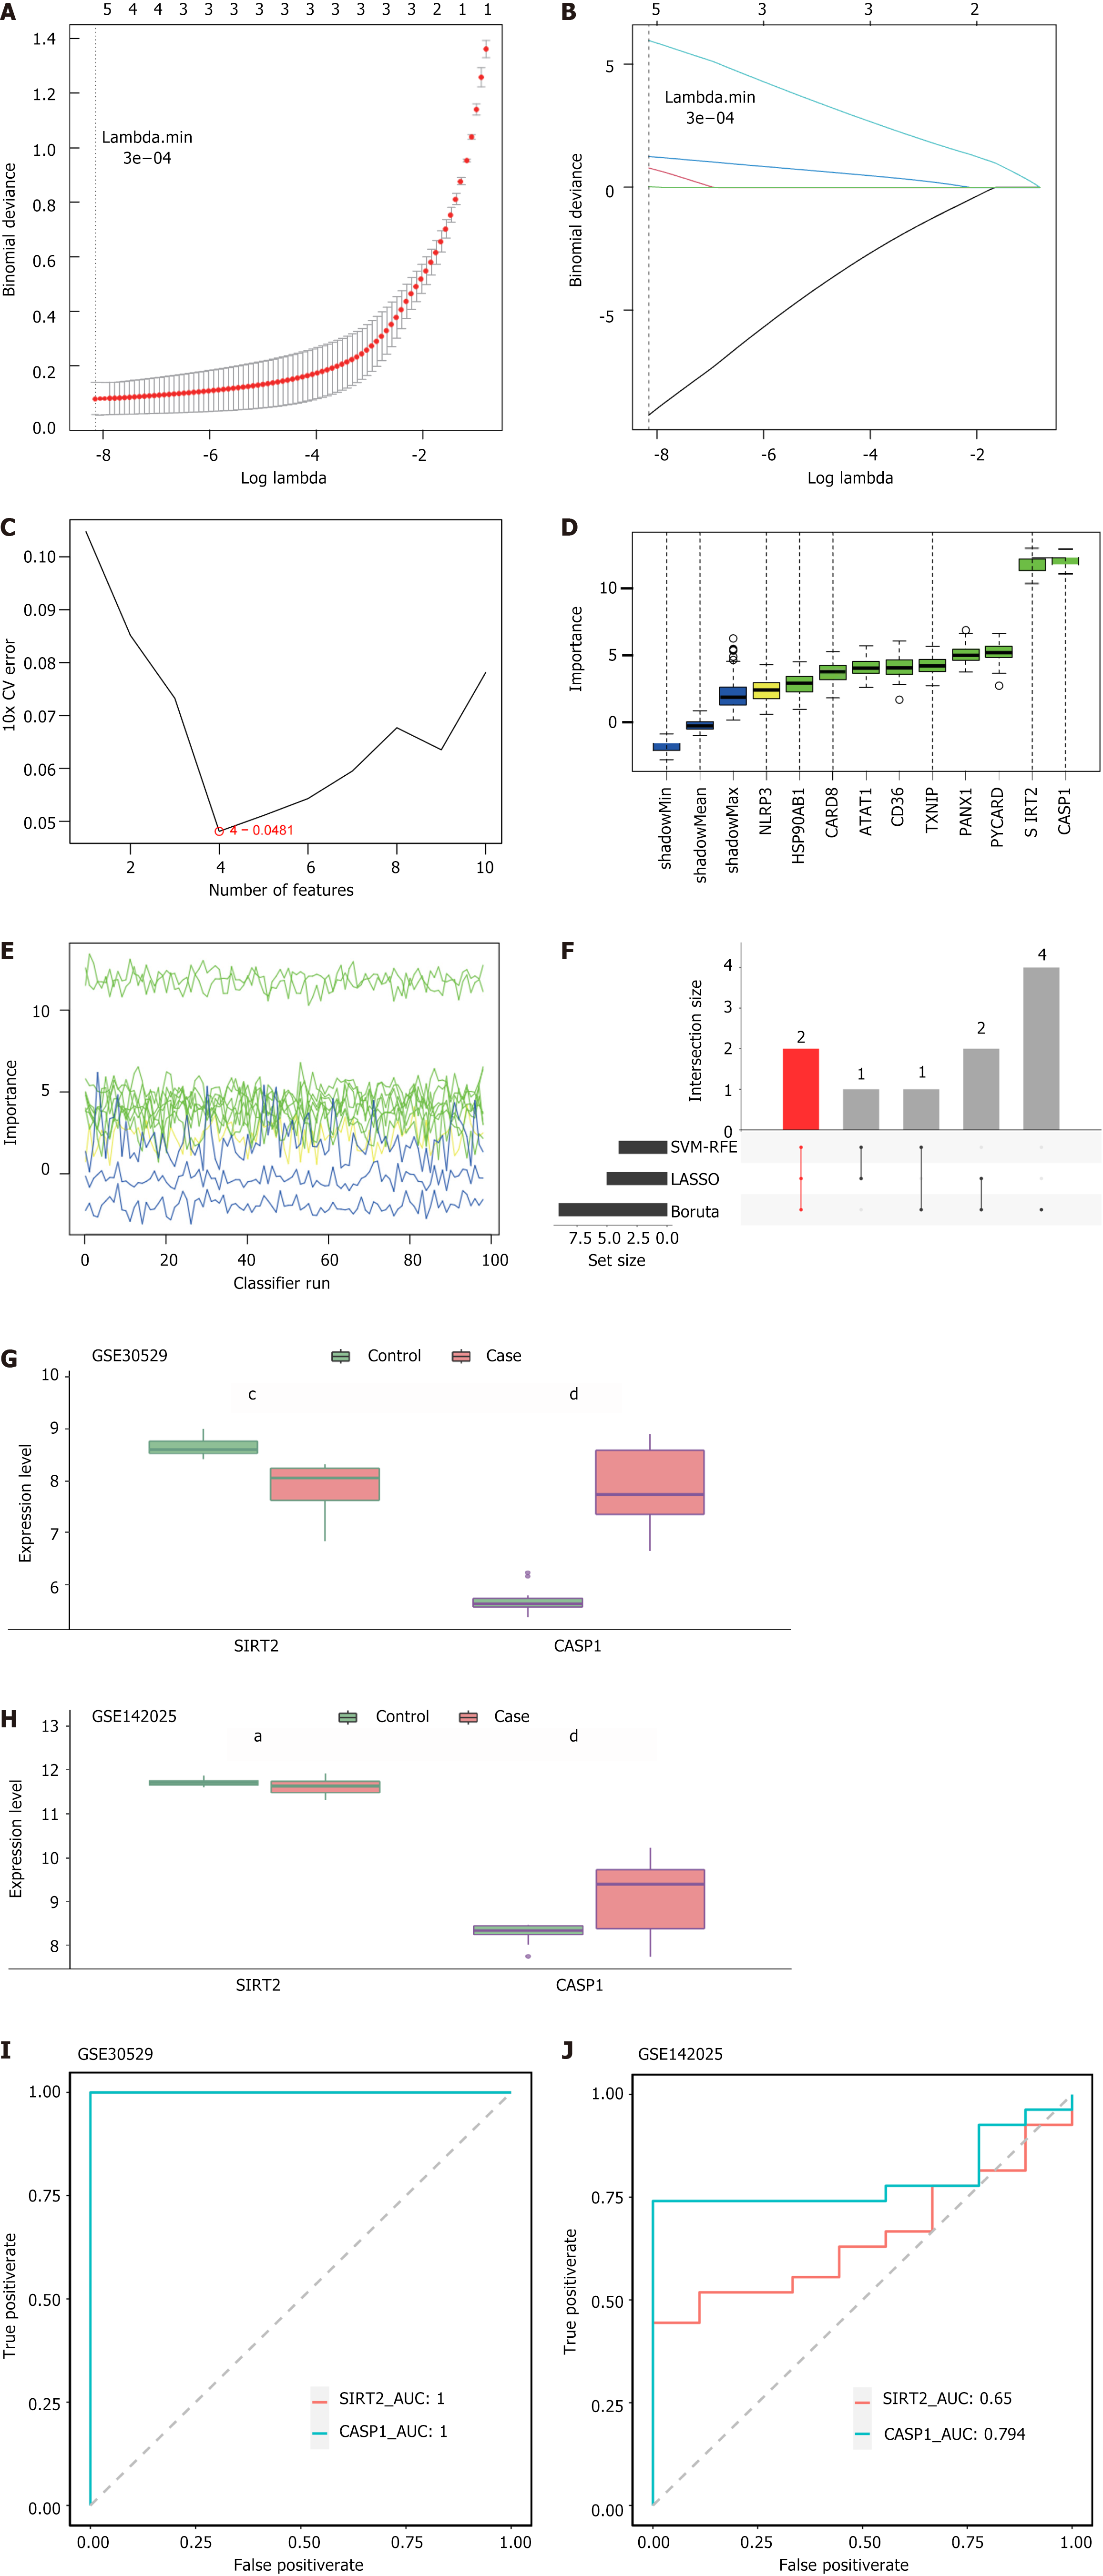
Figure 2 Sirtuin 2 and caspase 1 were considered as biomarkers.
A and B: Feature genes were selected using least absolute shrinkage and selection operator to obtain five genes; C: The process of feature gene selection using support vector machine recursive feature elimination four feature genes were identified among the differentially expressed low-risk groups; D: Plot of variation in Z-score; E: Boruta selection of nine feature genes with importance rankings; F: Overlapping genes were identified using three machine algorithms; G: Expression of sirtuin 2 (SIRT2) and caspase 1 (CASP1) in GSE30529; H: Expression of SIRT2 and CASP1 in GSE142025; I: Receiver operating characteristic curves for SIRT2 and CASP1 in GSE30529, with an area under the curve value of 1; J: Receiver operating characteristic curves of SIRT2 and CASP1 in GSE142025 with an area under the curve value of 0.65 (SIRT2) or 0794 (CASP1). aP < 0.05; cP < 0.001; dP < 0.0001. LASSO: Least absolute shrinkage and selection operator; SVM-RFE: Support vector machine recursive feature elimination; SIRT2: Sirtuin 2; CASP1: Caspase 1; AUC: Area under the curve.
- Citation: Zhou Y, Fang X, Huang LJ, Wu PW. Transcriptome and single-cell profiling of the mechanism of diabetic kidney disease. World J Diabetes 2025; 16(2): 101538
- URL: https://www.wjgnet.com/1948-9358/full/v16/i2/101538.htm
- DOI: https://dx.doi.org/10.4239/wjd.v16.i2.101538


