Copyright
©The Author(s) 2025.
World J Diabetes. Feb 15, 2025; 16(2): 100801
Published online Feb 15, 2025. doi: 10.4239/wjd.v16.i2.100801
Published online Feb 15, 2025. doi: 10.4239/wjd.v16.i2.100801
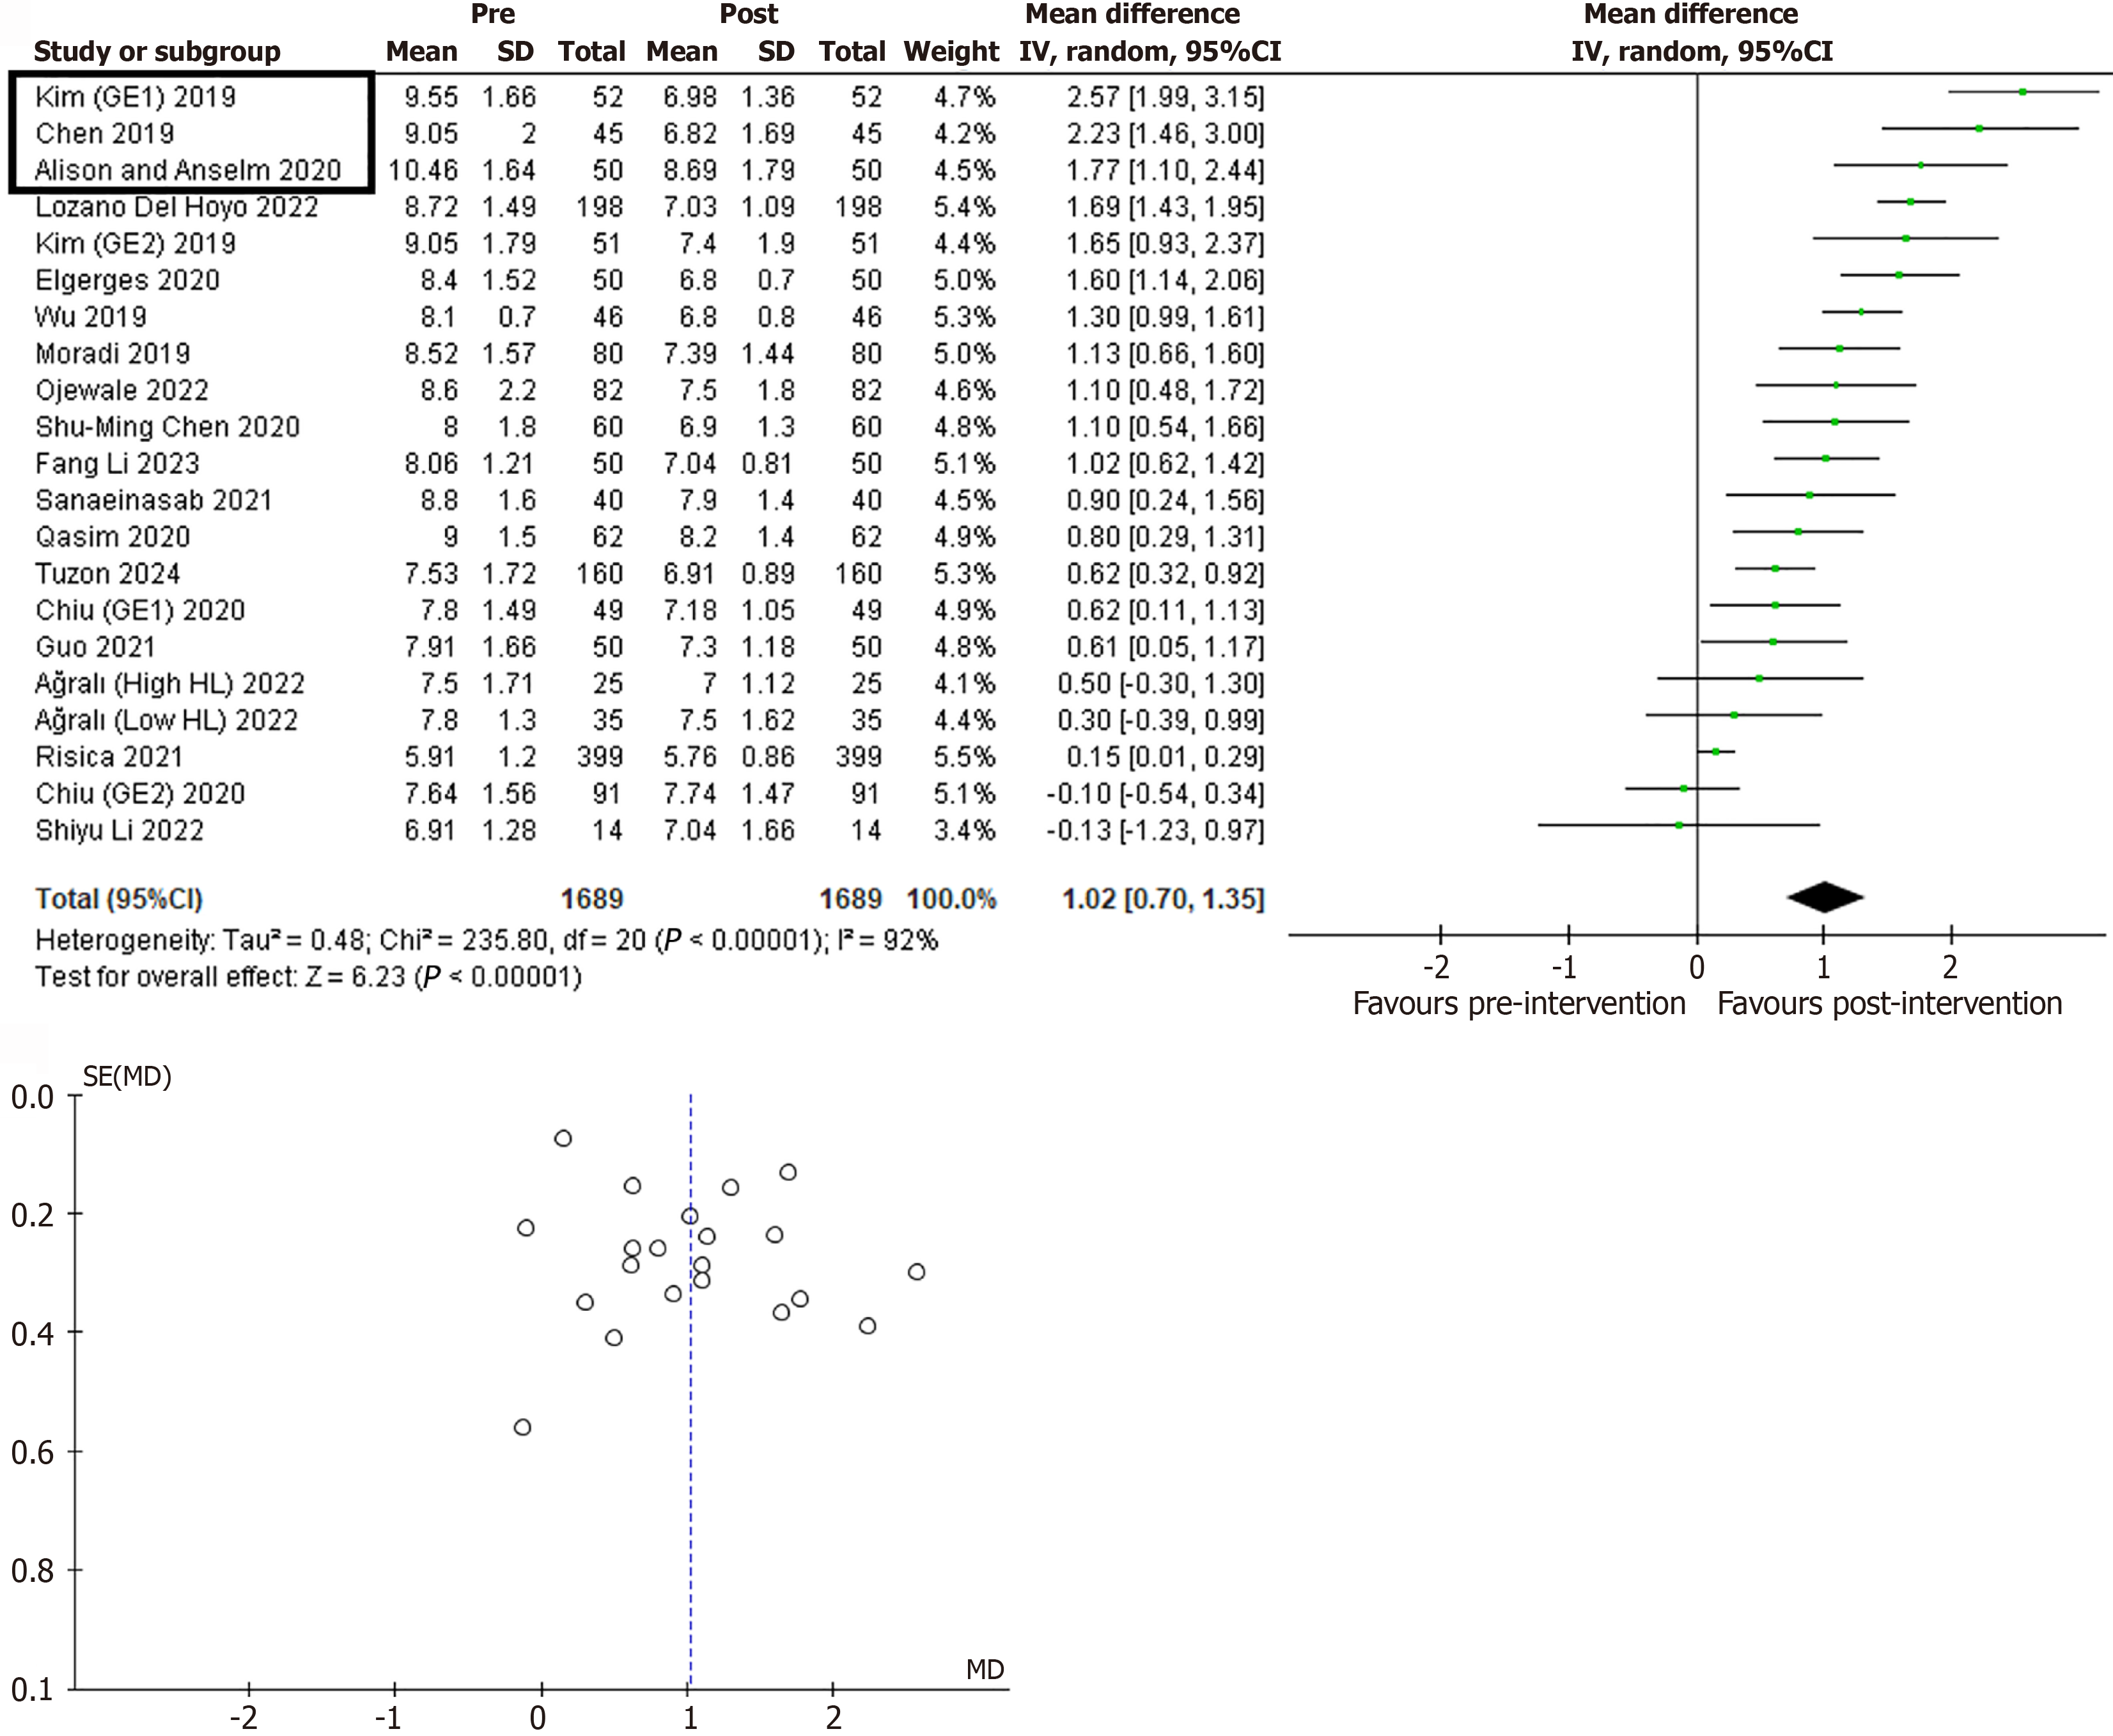
Figure 2 Meta-analysis (mean difference method) of the publications studying intragroup differences (baseline vs post-treatment) in glycated haemoglobin at study completion and funnel plot (for publication bias).
Note the box marking the three items with the biggest differences. CI: Confidence interval; MD: Mean difference; SD: Standard deviation; SE: Standard error.
- Citation: Grande-Alonso M, Barbado García M, Cristóbal-Aguado S, Aguado-Henche S, Moreno-Gómez-Toledano R. Improving nursing care protocols for diabetic patients through a systematic review and meta-analysis of recent years. World J Diabetes 2025; 16(2): 100801
- URL: https://www.wjgnet.com/1948-9358/full/v16/i2/100801.htm
- DOI: https://dx.doi.org/10.4239/wjd.v16.i2.100801


