Copyright
©The Author(s) 2025.
World J Diabetes. Feb 15, 2025; 16(2): 100395
Published online Feb 15, 2025. doi: 10.4239/wjd.v16.i2.100395
Published online Feb 15, 2025. doi: 10.4239/wjd.v16.i2.100395
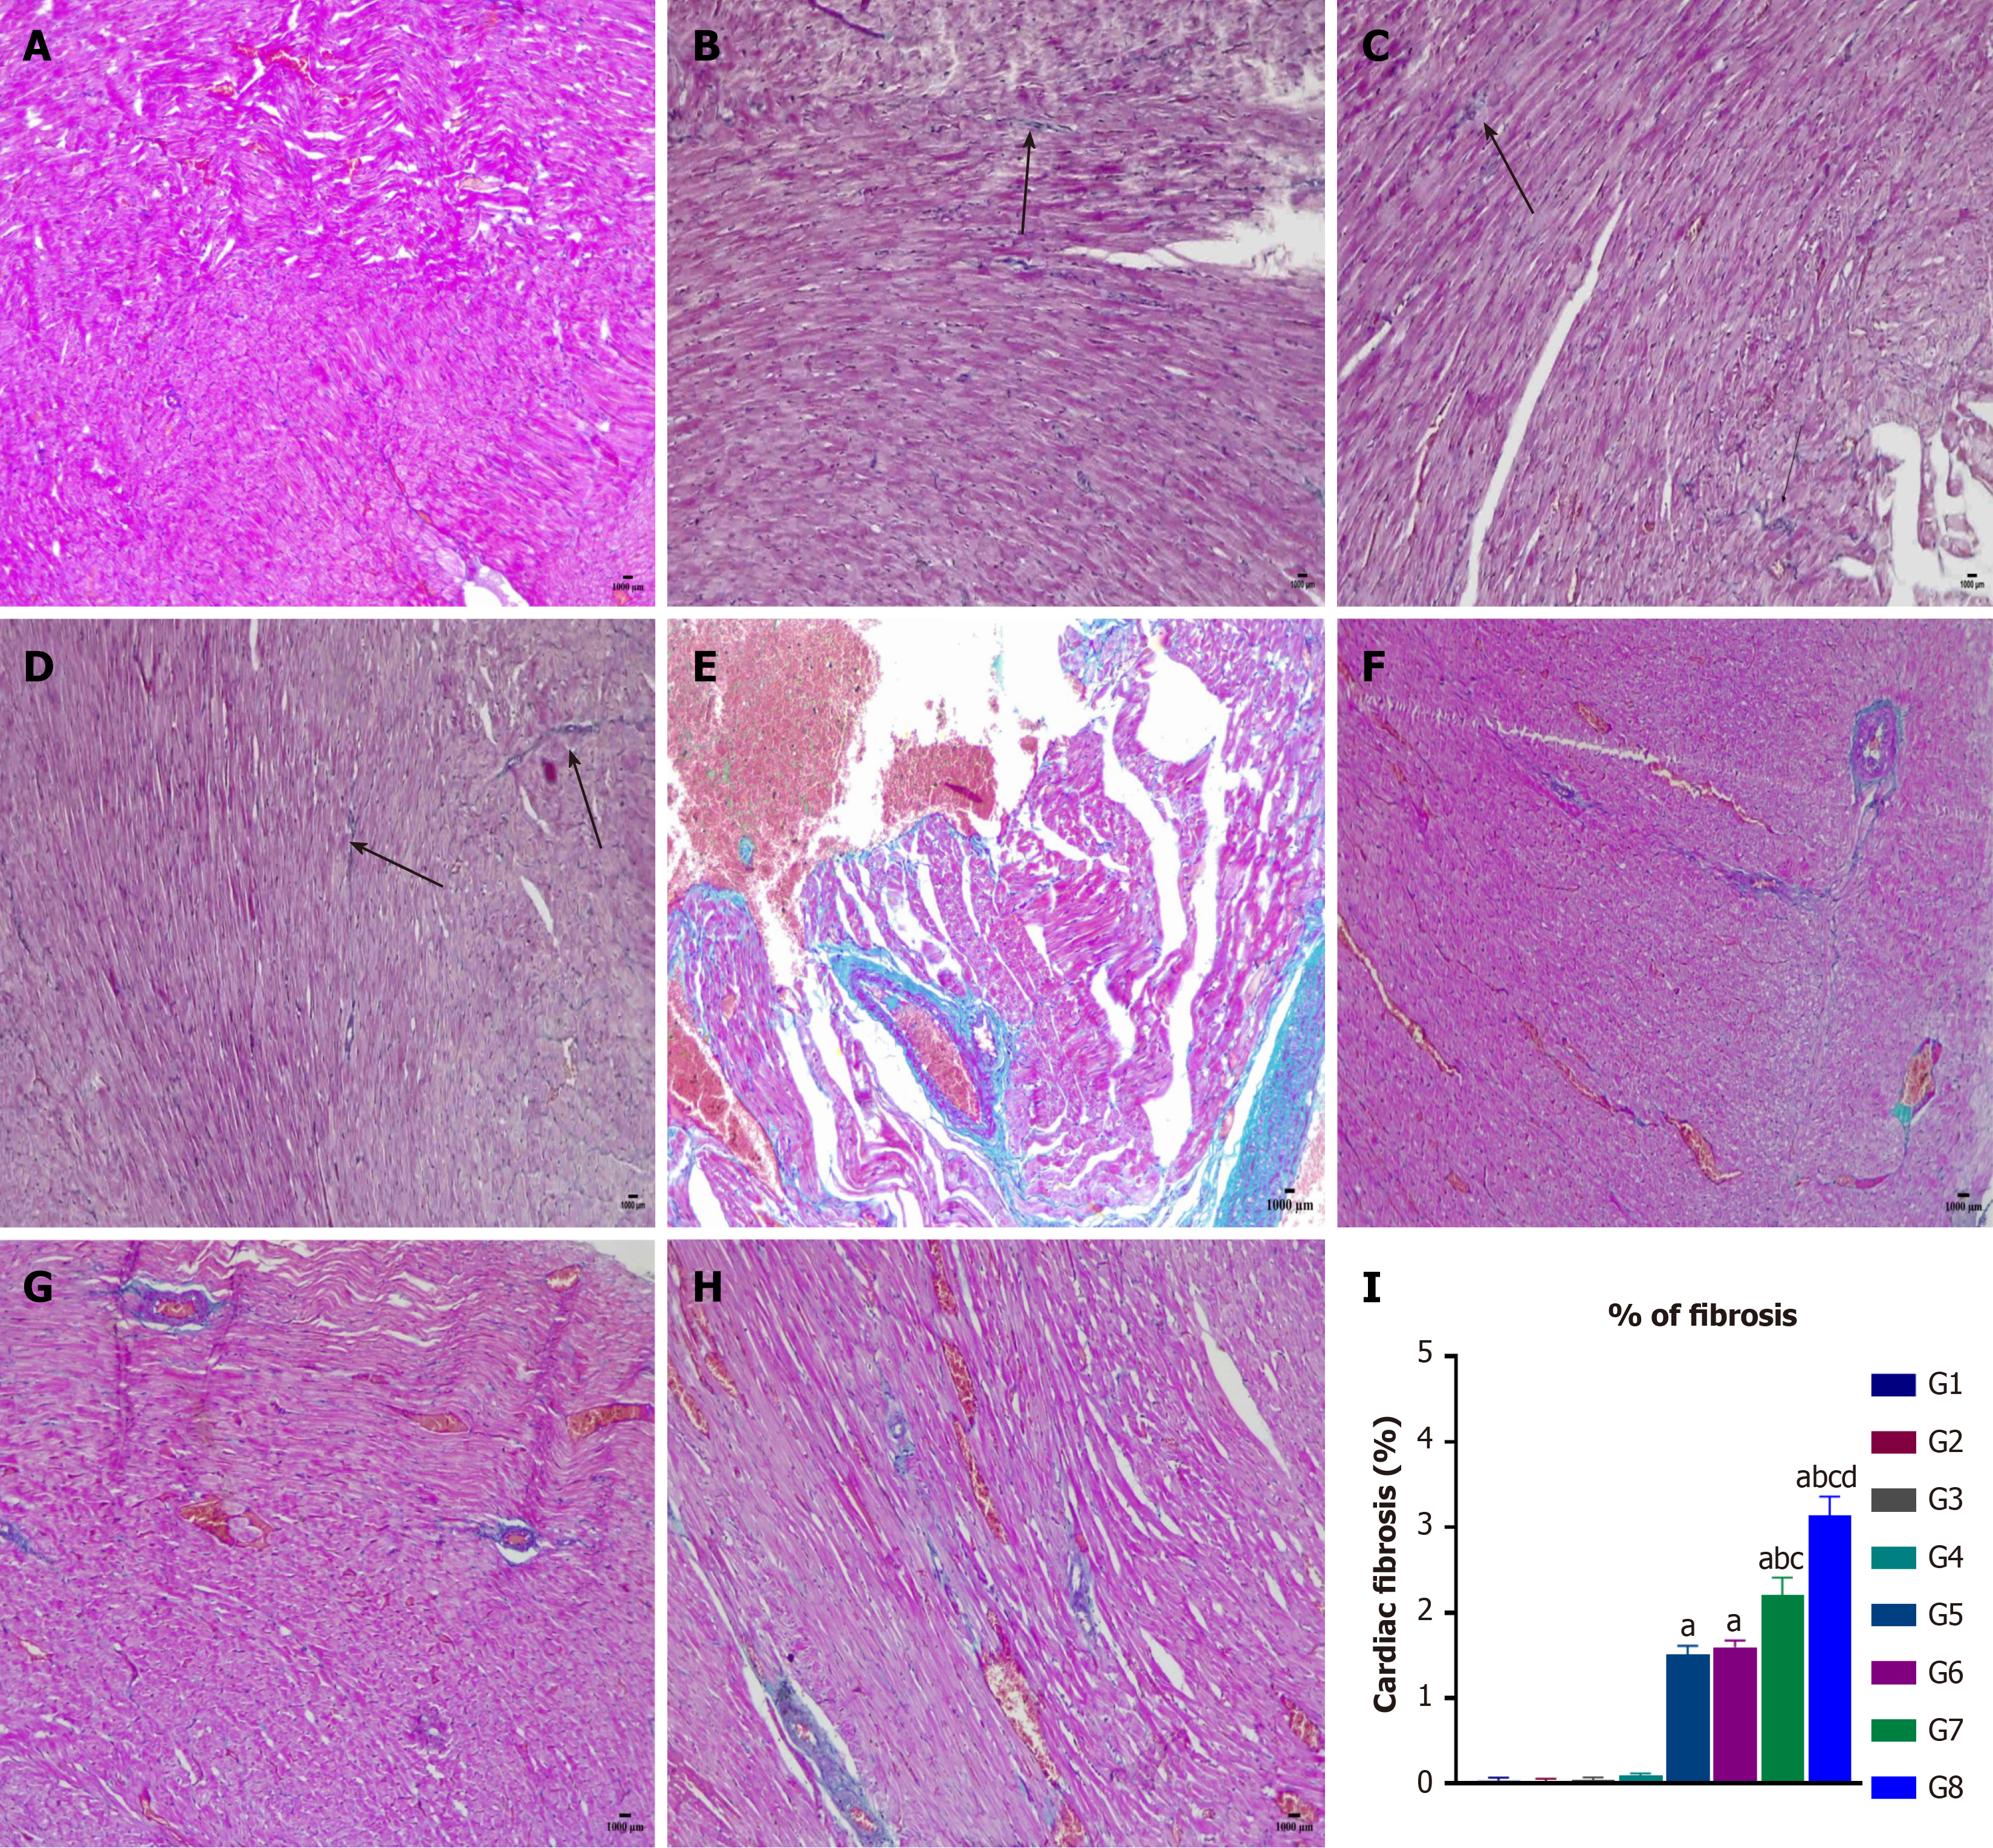
Figure 6 Histopathology of rats’ heart (Masson trichrome stain).
A: G1 = Control group; B: G2 = Normal rats received 0.5 g/kg/day of L-arginine (L-Arg); C: G3 = Normal rats received 1 g/kg/day of L-Arg; D: G4 = Normal rats received 1.5 g/kg/day of L-Arg; E: G5 = Diabetic group; F: G6 = Diabetic rats received 0.5 g/kg/day of L-Arg; G: G7 = Diabetic rats received 1 g/kg/day of L-Arg; H: G8 = Diabetic rats received 1.5 g/kg/day of L-Arg; I: Cardiac fibrosis. Results are presented as mean ± SEM (n = 6). aP < 0.05 vs the control group. bP < 0.05 vs the diabetic group. cP < 0.05 vs the diabetic + L-Arg 05 g/kg group. dP < 0.05 vs the diabetic + L-Arg 1 g/kg group.
- Citation: Mansouri RA, Aboubakr EM, Alshaibi HF, Ahmed AM. L-arginine administration exacerbates myocardial injury in diabetics via prooxidant and proinflammatory mechanisms along with myocardial structural disruption. World J Diabetes 2025; 16(2): 100395
- URL: https://www.wjgnet.com/1948-9358/full/v16/i2/100395.htm
- DOI: https://dx.doi.org/10.4239/wjd.v16.i2.100395


