Copyright
©The Author(s) 2025.
World J Diabetes. Feb 15, 2025; 16(2): 100395
Published online Feb 15, 2025. doi: 10.4239/wjd.v16.i2.100395
Published online Feb 15, 2025. doi: 10.4239/wjd.v16.i2.100395
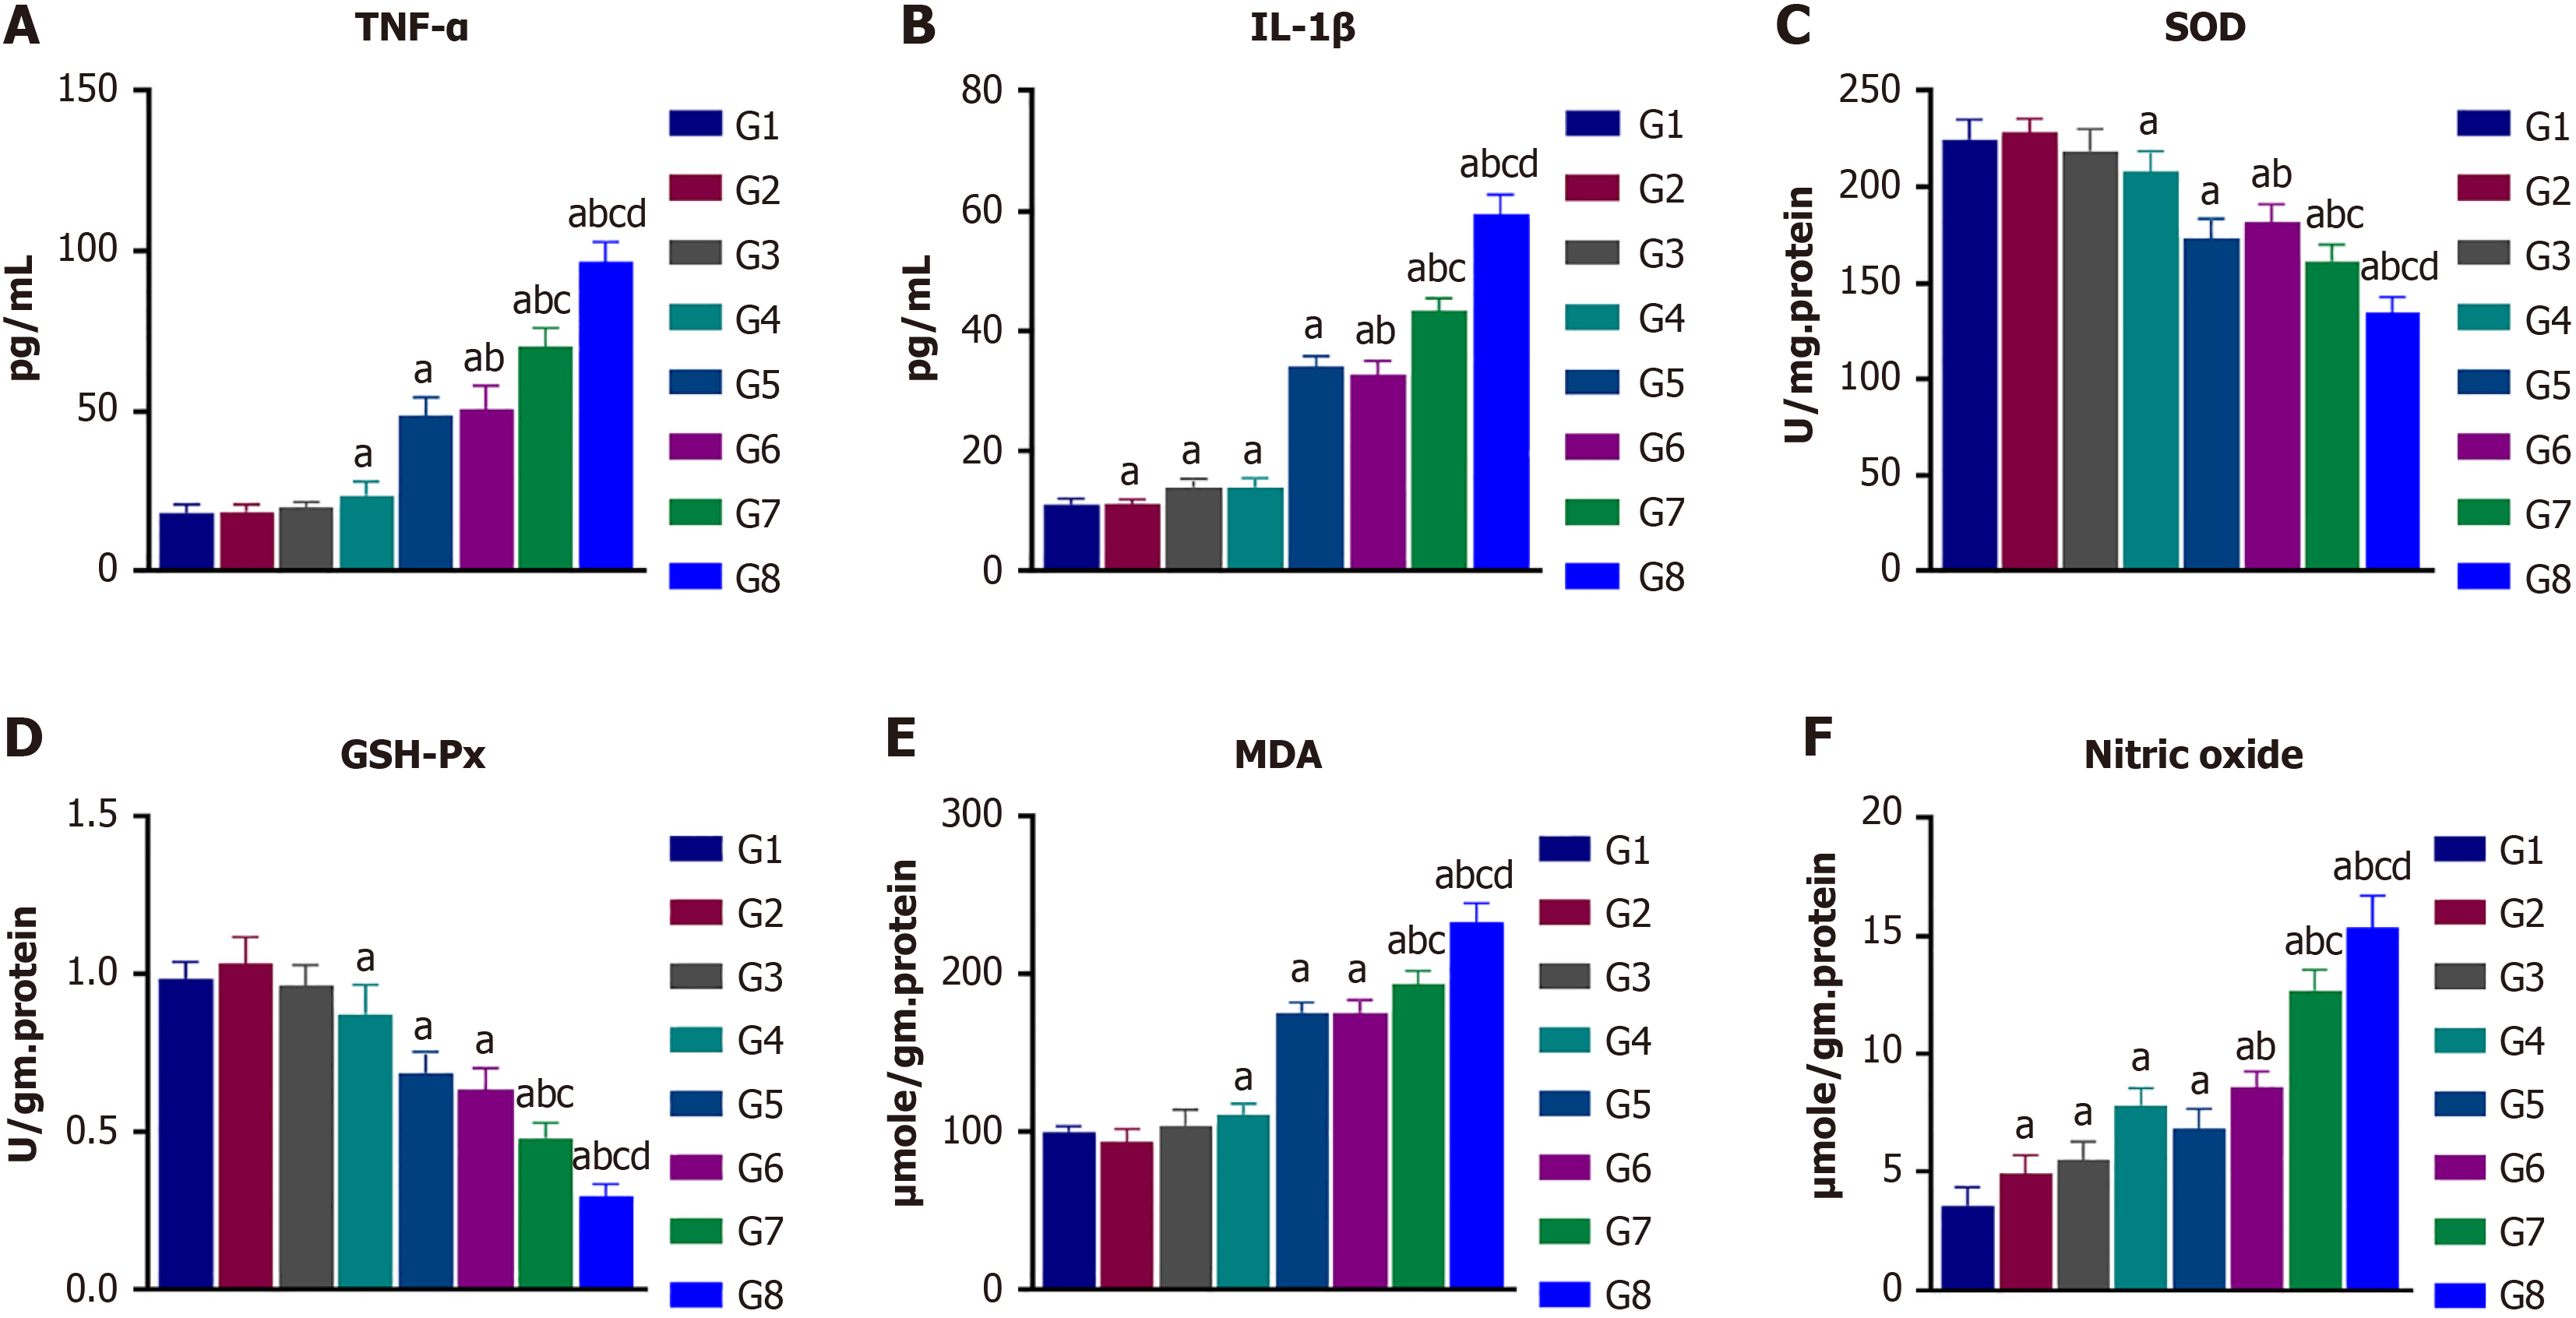
Figure 4 Effect of L-arginine on the activities of serum tumor necrosis factor-alpha, interleukin-1 beta, superoxide dismutase and glutathione peroxidase, malondialdehyde, nitric oxide, in the normal and treated rat groups.
A: Tumor necrosis factor-alpha; B: Interleukin-1 beta; C: Superoxide dismutase; D: Glutathione peroxidase; E: Malondialdehyde; F: Nitric oxide. G1 = Control group, G2 = Normal rats received 0.5 g/kg/day of L-arginine (L-Arg), G3 = Normal rats received 1 g/kg/day of L-Arg, G4 = Normal rats received 1.5 g/kg/day of L-Arg, G5 = Diabetic group, G6 = Diabetic rats received 0.5 g/kg/day of L-Arg, G7 = Diabetic rats received 1 g/kg/day of L-Arg, G8 = Diabetic rats received 1.5 g/kg/day of L-Arg. The data presented as means ± SE (n = 12). aP < 0.05 vs the control group. bP < 0.05 vs the diabetic group. cP < 0.05 vs to the diabetic + L-Arg 05 g/kg group. dP < 0.05 vs the diabetic + L-arg 1 g/kg group. TNF-α: Tumor necrosis factor-alpha; IL-1β: interleukin-1 beta; SOD: superoxide dismutase; GSH-Px: Glutathione peroxidase; MDA: Malondialdehyde.
- Citation: Mansouri RA, Aboubakr EM, Alshaibi HF, Ahmed AM. L-arginine administration exacerbates myocardial injury in diabetics via prooxidant and proinflammatory mechanisms along with myocardial structural disruption. World J Diabetes 2025; 16(2): 100395
- URL: https://www.wjgnet.com/1948-9358/full/v16/i2/100395.htm
- DOI: https://dx.doi.org/10.4239/wjd.v16.i2.100395


