Copyright
©The Author(s) 2025.
World J Diabetes. Jan 15, 2025; 16(1): 99755
Published online Jan 15, 2025. doi: 10.4239/wjd.v16.i1.99755
Published online Jan 15, 2025. doi: 10.4239/wjd.v16.i1.99755
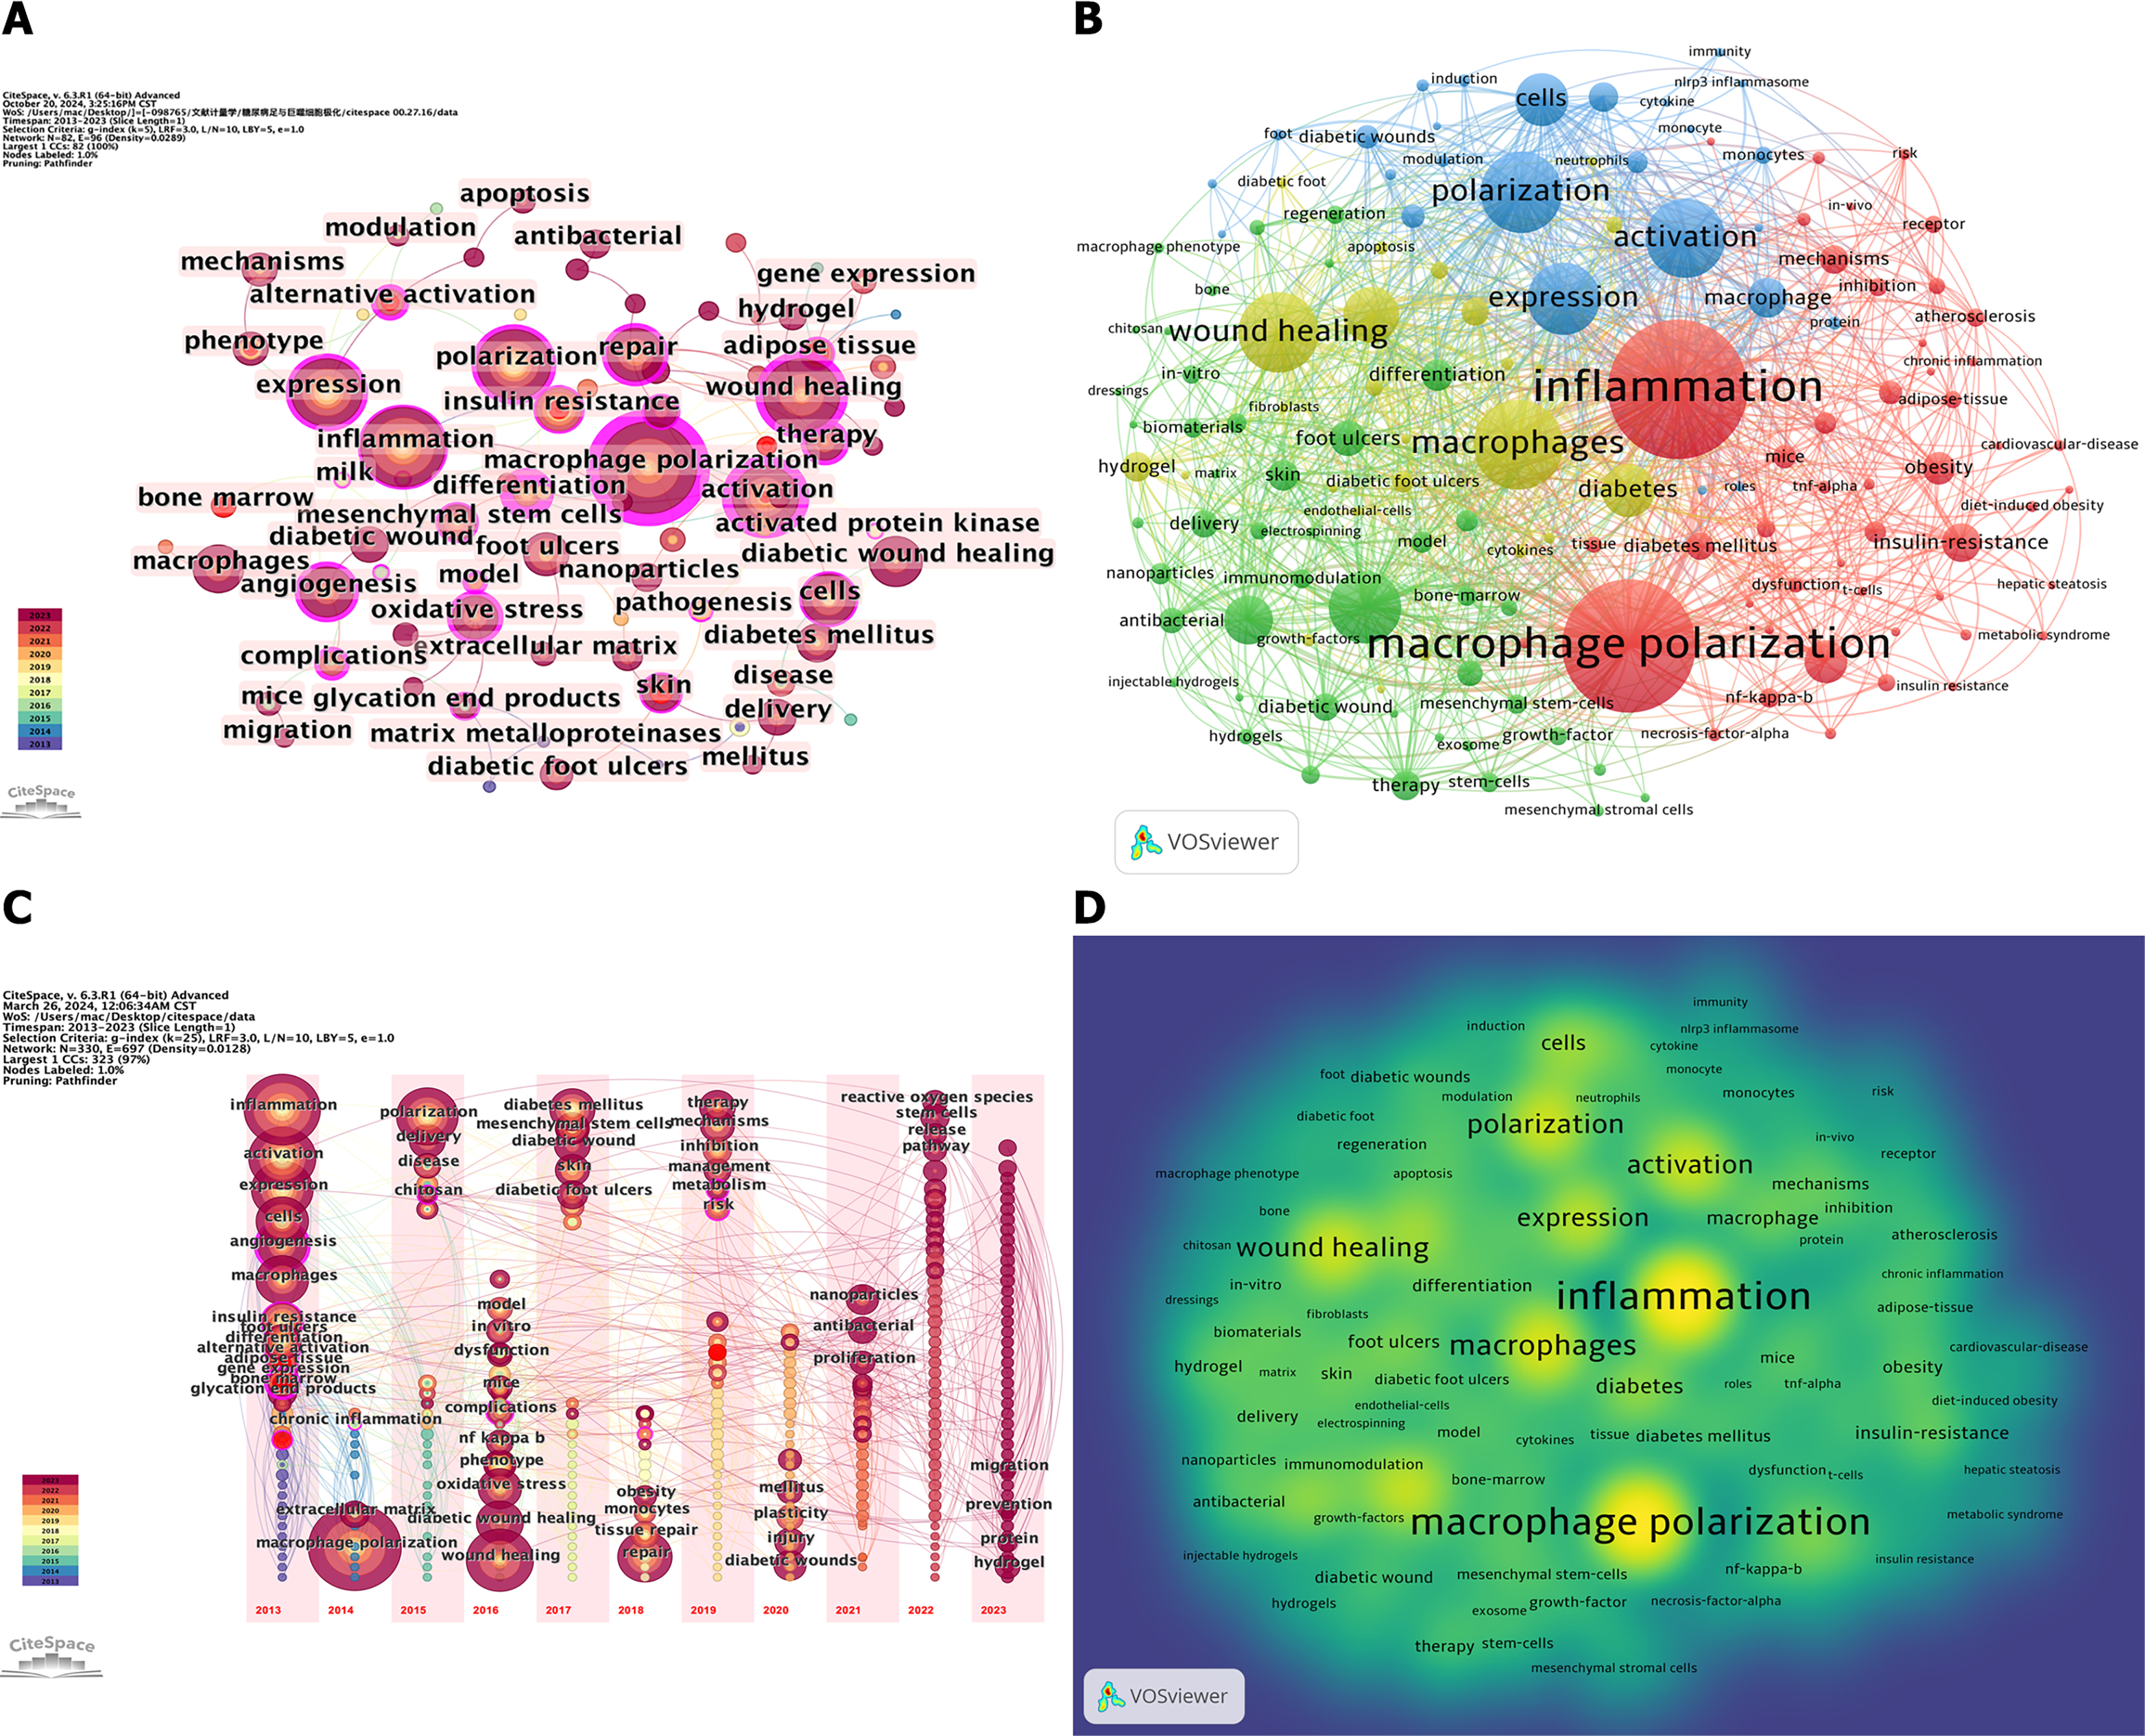
Figure 9 Keyword network graphs.
A: A visualization graph of keywords; B: A time-zone map of keywords; C: VOSviewer-generated network visualization of keywords with a minimum of two occurrences; D: The top 10 keywords in terms of centrality.
- Citation: Zhang YW, Sun L, Wang YN, Zhan SY. Role of macrophage polarization in diabetic foot ulcer healing: A bibliometric study. World J Diabetes 2025; 16(1): 99755
- URL: https://www.wjgnet.com/1948-9358/full/v16/i1/99755.htm
- DOI: https://dx.doi.org/10.4239/wjd.v16.i1.99755


