Copyright
©The Author(s) 2025.
World J Diabetes. Jan 15, 2025; 16(1): 96032
Published online Jan 15, 2025. doi: 10.4239/wjd.v16.i1.96032
Published online Jan 15, 2025. doi: 10.4239/wjd.v16.i1.96032
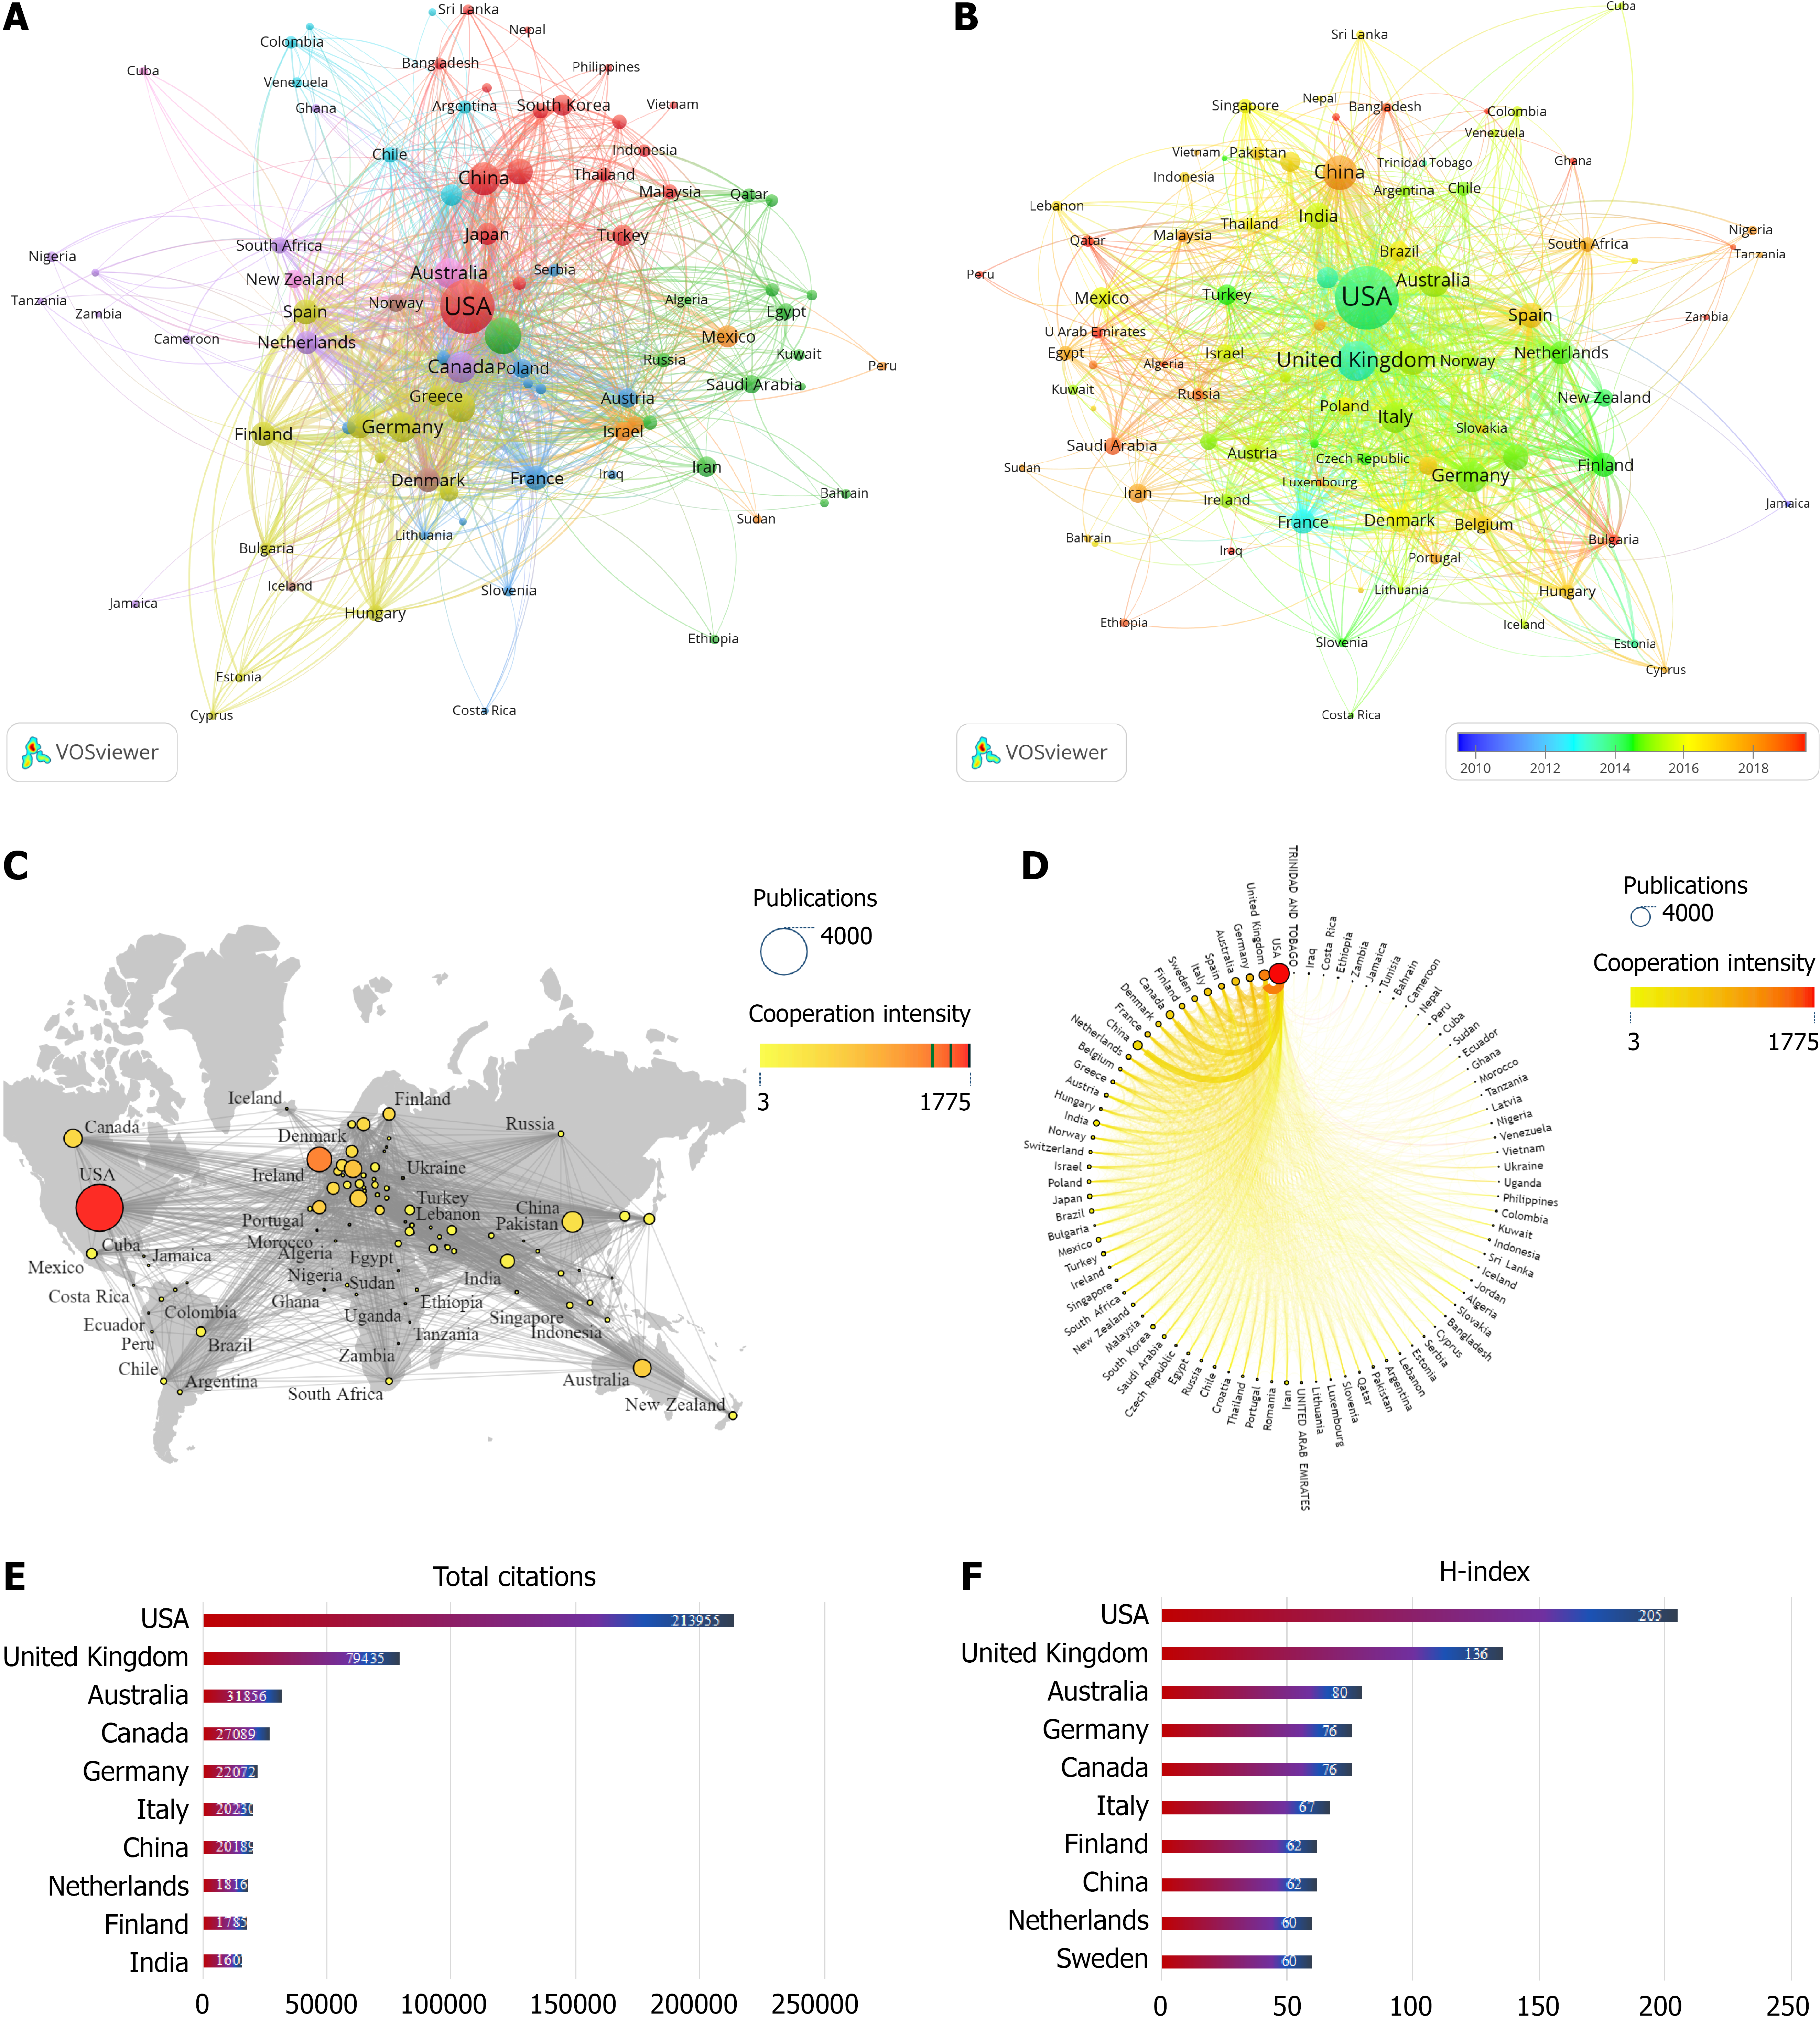
Figure 3 Contribution of different countries to the study of type 2 diabetes mellitus in children and adolescents.
A: Map of country collaborations related to type 2 diabetes mellitus in children and adolescents. The circles in the graph represent countries and the lines between the circles represent collaborations between countries; B: Timeline of national policy issuance; C: World map of the intensity of cooperation between countries; D: A circle diagram that evaluates international collaboration between clusters; E: Top 10 in terms of co-citation frequency; F: Top 10 countries for H-index.
- Citation: Zhang FS, Li HJ, Yu X, Song YP, Ren YF, Qian XZ, Liu JL, Li WX, Huang YR, Gao K. Global trends and hotspots of type 2 diabetes in children and adolescents: A bibliometric study and visualization analysis. World J Diabetes 2025; 16(1): 96032
- URL: https://www.wjgnet.com/1948-9358/full/v16/i1/96032.htm
- DOI: https://dx.doi.org/10.4239/wjd.v16.i1.96032


