Copyright
©The Author(s) 2024.
World J Diabetes. Sep 15, 2024; 15(9): 1979-2001
Published online Sep 15, 2024. doi: 10.4239/wjd.v15.i9.1979
Published online Sep 15, 2024. doi: 10.4239/wjd.v15.i9.1979
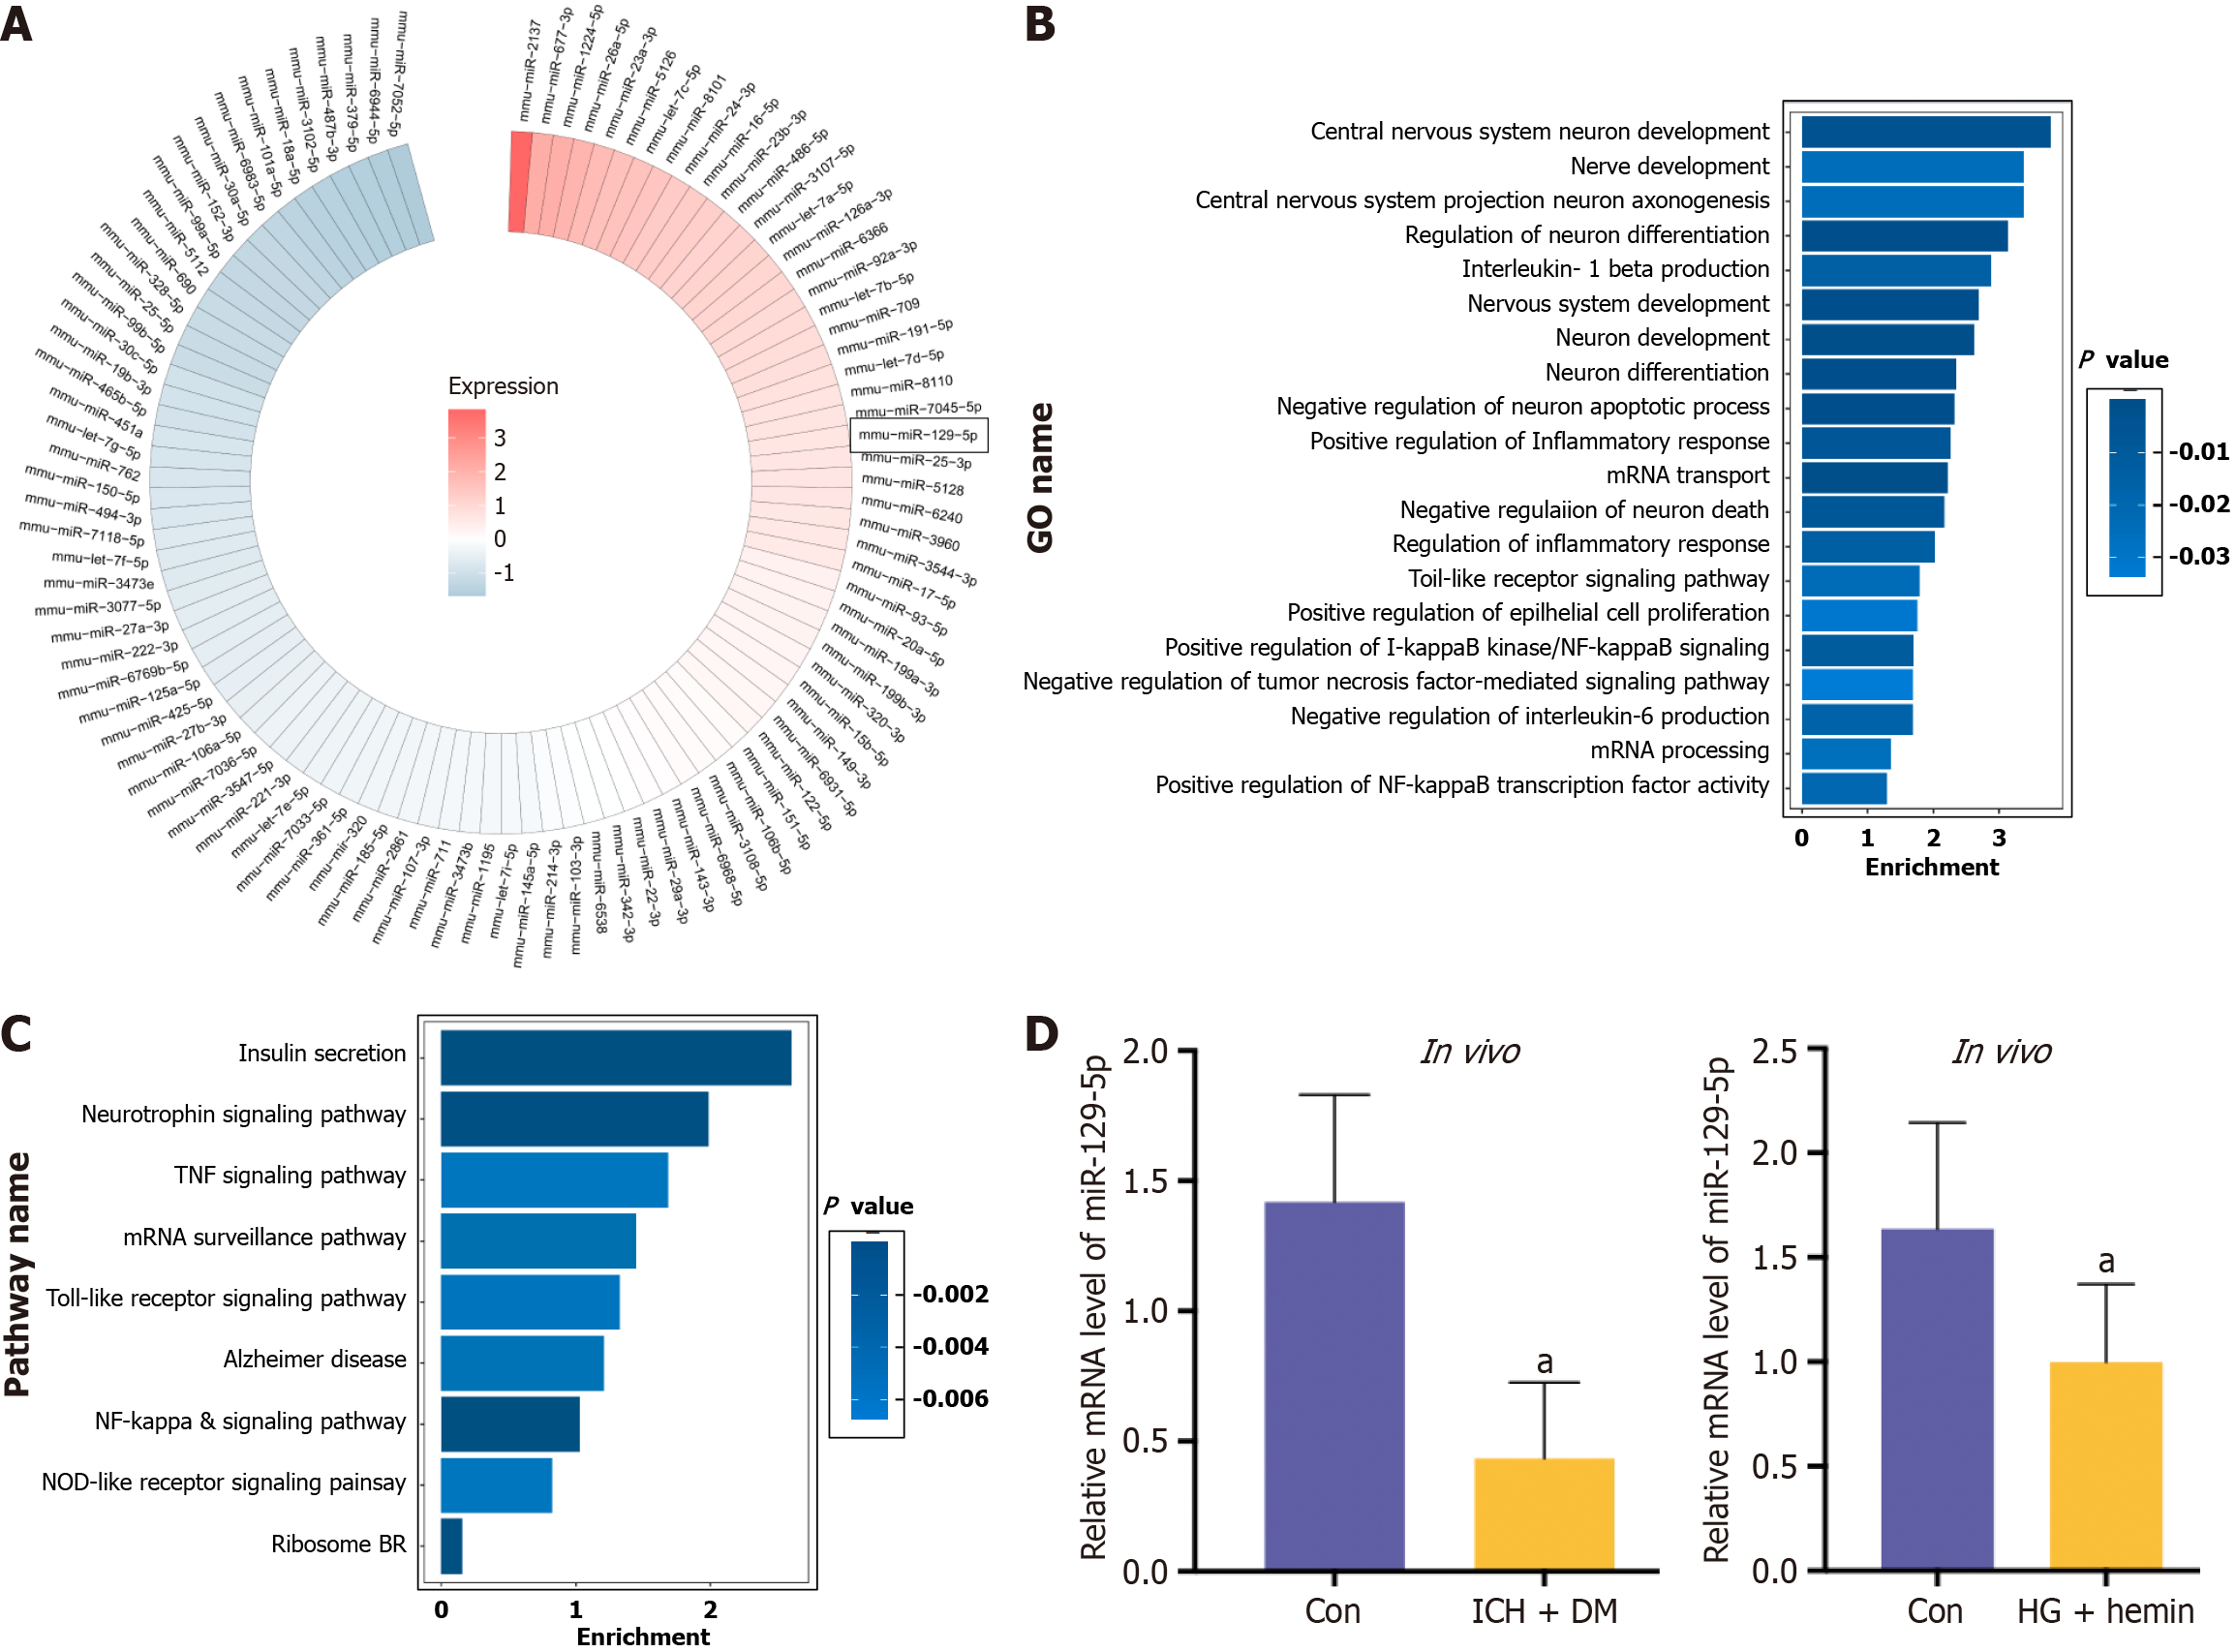
Figure 5 Screening for microRNA.
A: Heat maps showed microRNA content in bone marrow-derived mesenchymal stem cell-derived exosomes; B: Gene Ontology functional enrichment analysis; C: Kyoto Encyclopedia of Genes and Genomes pathway analysis; D: The expression of microRNA-129-5p in the intracerebral hemorrhage + diabetes mellitus mice and high glucose + hemin-treated BV2 was detected by quantitative polymerase chain reaction assay. The experimental data are expressed as mean ± SD. In vivo: aP < 0.05, control group vs intracerebral hemorrhage + diabetes mellitus group, t-test. In vitro: aP < 0.05, control group vs high glucose + hemin group, t-test. GO: Gene Ontology; TNF: Tumor necrosis factor; HG: High glucose; DM: Diabetes mellitus; ICH: Intracerebral hemorrhage.
- Citation: Wang YY, Li K, Wang JJ, Hua W, Liu Q, Sun YL, Qi JP, Song YJ. Bone marrow-derived mesenchymal stem cell-derived exosome-loaded miR-129-5p targets high-mobility group box 1 attenuates neurological-impairment after diabetic cerebral hemorrhage. World J Diabetes 2024; 15(9): 1979-2001
- URL: https://www.wjgnet.com/1948-9358/full/v15/i9/1979.htm
- DOI: https://dx.doi.org/10.4239/wjd.v15.i9.1979


