Copyright
©The Author(s) 2024.
World J Diabetes. Sep 15, 2024; 15(9): 1962-1978
Published online Sep 15, 2024. doi: 10.4239/wjd.v15.i9.1962
Published online Sep 15, 2024. doi: 10.4239/wjd.v15.i9.1962
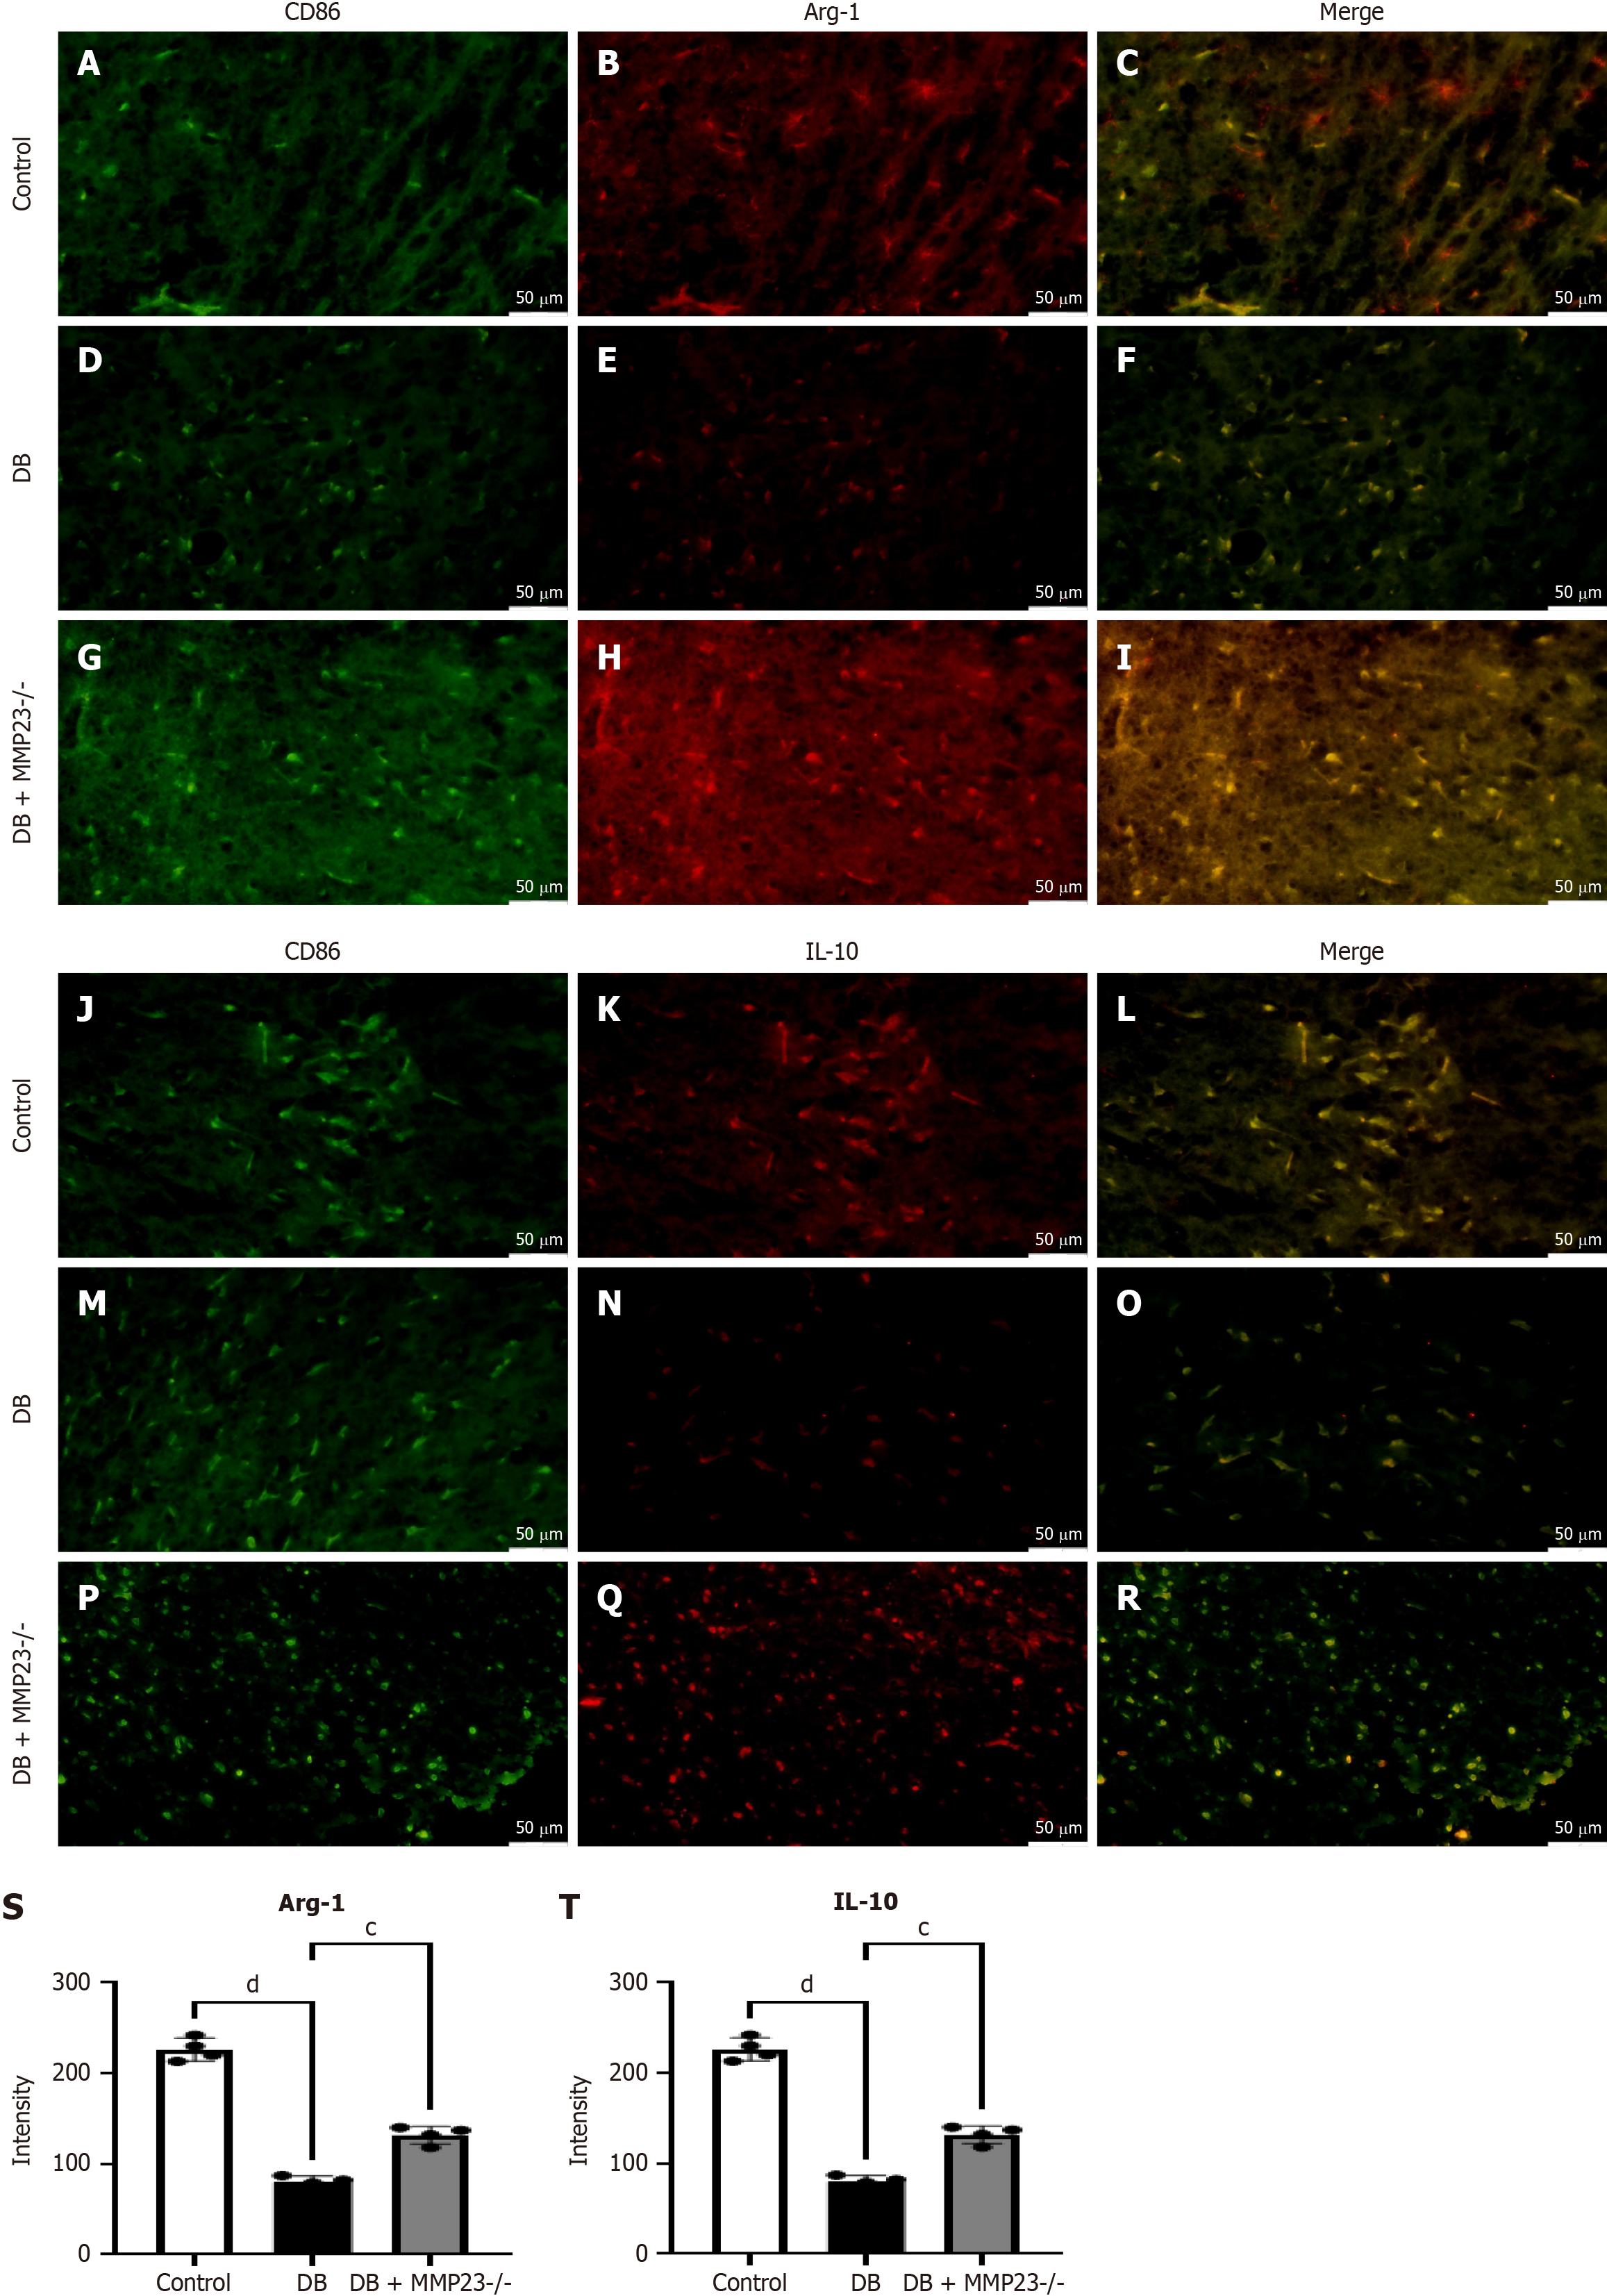
Figure 8 In vivo studies demonstrated that MMP23 knockout upregulates arginase-1 and interleukin-10.
A-R: MMP23 knockout led to M2 polarization. After inducing diabetes with the diabetes treatment, the fluorescence intensity of arginase-1 (A-I) and interleukin-10 (J-R) significantly decreased compared with that before treatment; S and T: Indicating fluorescence intensity levels after MMP23 knockout treatment. Scale bar = 50 μm. cP < 0.001, dP < 0.0001. DB: Diabetes group; Arg-1: Arginase-1; IL-10: Interleukin-10.
- Citation: Lu M, Guo XW, Zhang FF, Wu DH, Xie D, Luo FQ. Dexmedetomidine ameliorates diabetic intestinal injury by promoting the polarization of M2 macrophages through the MMP23B pathway. World J Diabetes 2024; 15(9): 1962-1978
- URL: https://www.wjgnet.com/1948-9358/full/v15/i9/1962.htm
- DOI: https://dx.doi.org/10.4239/wjd.v15.i9.1962


