Copyright
©The Author(s) 2024.
World J Diabetes. Sep 15, 2024; 15(9): 1962-1978
Published online Sep 15, 2024. doi: 10.4239/wjd.v15.i9.1962
Published online Sep 15, 2024. doi: 10.4239/wjd.v15.i9.1962
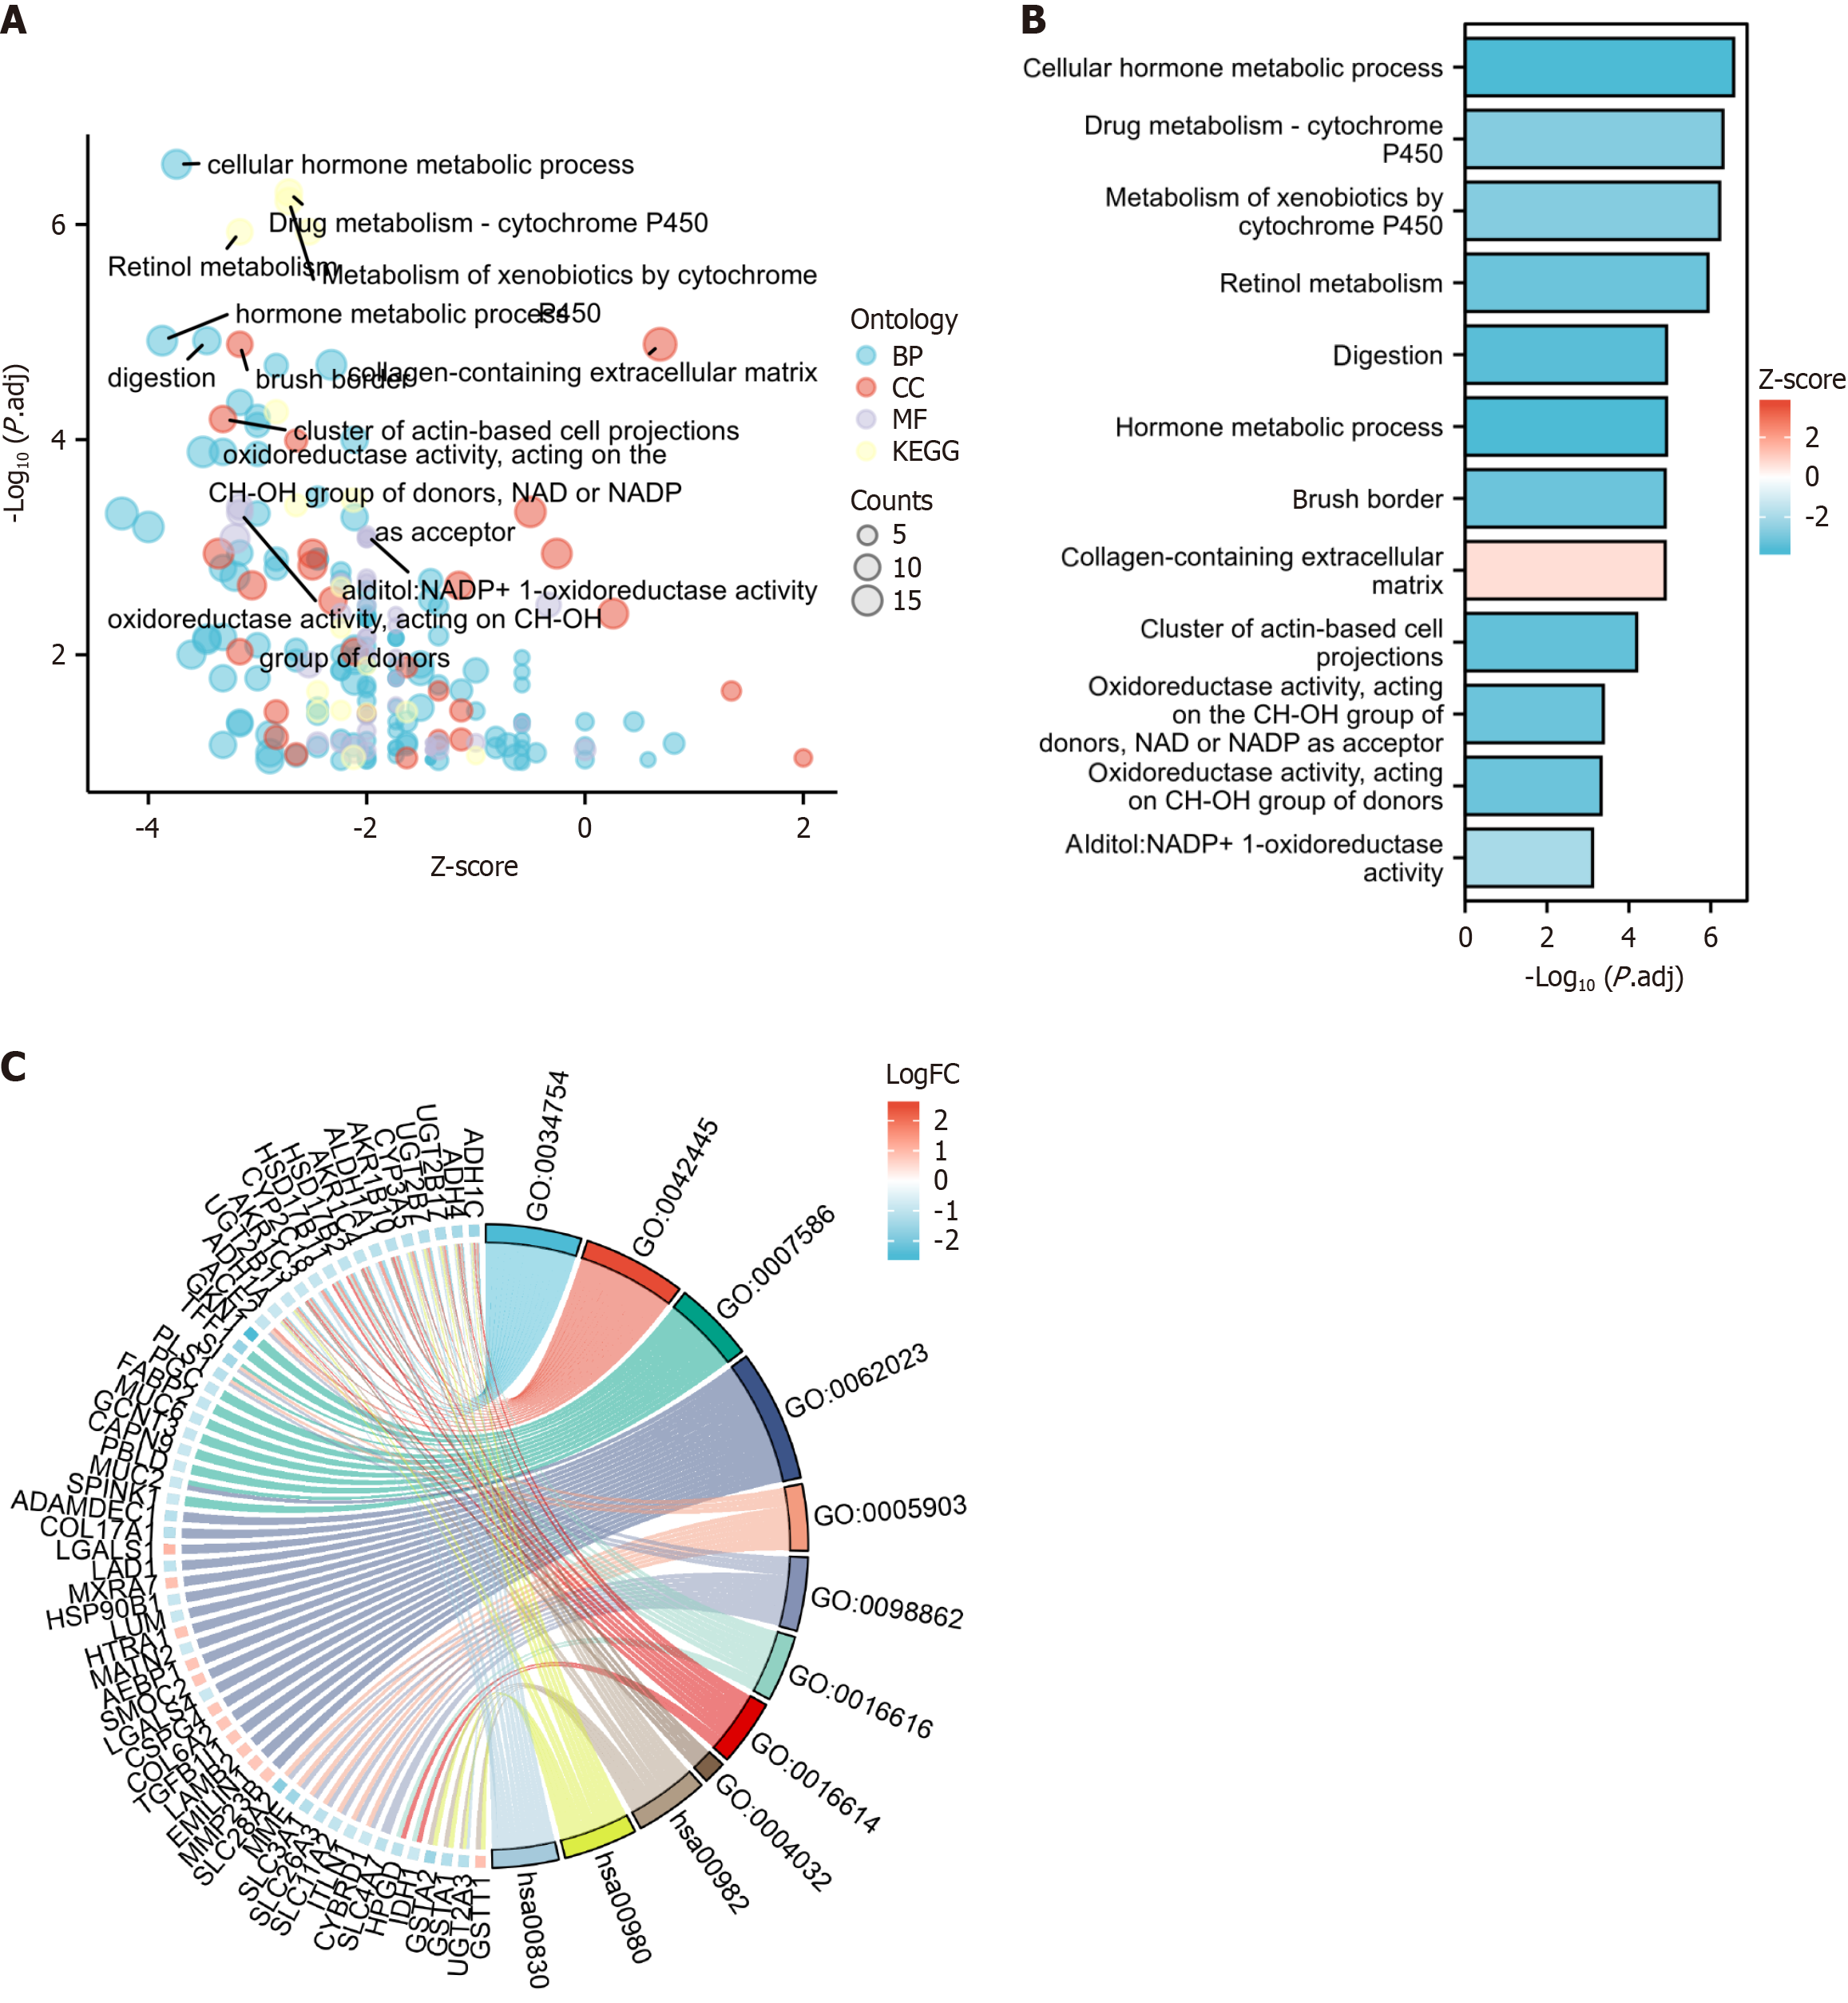
Figure 3 Functional and pathway enrichment.
Functional and pathway enrichment analyses were conducted using DAVID to gain a comprehensive understanding of the role played by the 31 differentially expressed genes identified in the brain tissue dataset. A-C: Main identified pathways: Cellular hormone metabolic process, hormone metabolic process, digestion, response to toxic substance, retinol metabolic process, collagen-containing extracellular matrix, brush border, and cluster of actin-based cell projections. KEGG: Kyoto Encyclopedia of Genes and Genomes; BP: Biological process; CC: Cell composition; MF: Molecular function; GO:0034754: Cellular hormone metabolic process; GO:0042445: Hormone metabolic process; GO:0007586: Digestion; GO:0062023: Collagen-containing extracellular matrix; GO:0005903: Brush border; GO:0098862: Cluster of actin-based cell projections; GO:0016616: Oxidoreductase activity, acting on the CH-OH group of donors, NAD or NADP as acceptor; GO:0016614: Oxidoreductase activity, acting on CH-OH group of donors; GO:0004032: Alditol:NADP+ 1-oxidoreductase activity; hsa00982: Drug metabolism-cytochrome P450; hsa00980: Metabolism of xenobiotics by cytochrome P450; hsa00830: Retinol metabolism.
- Citation: Lu M, Guo XW, Zhang FF, Wu DH, Xie D, Luo FQ. Dexmedetomidine ameliorates diabetic intestinal injury by promoting the polarization of M2 macrophages through the MMP23B pathway. World J Diabetes 2024; 15(9): 1962-1978
- URL: https://www.wjgnet.com/1948-9358/full/v15/i9/1962.htm
- DOI: https://dx.doi.org/10.4239/wjd.v15.i9.1962


