Copyright
©The Author(s) 2024.
World J Diabetes. Sep 15, 2024; 15(9): 1962-1978
Published online Sep 15, 2024. doi: 10.4239/wjd.v15.i9.1962
Published online Sep 15, 2024. doi: 10.4239/wjd.v15.i9.1962
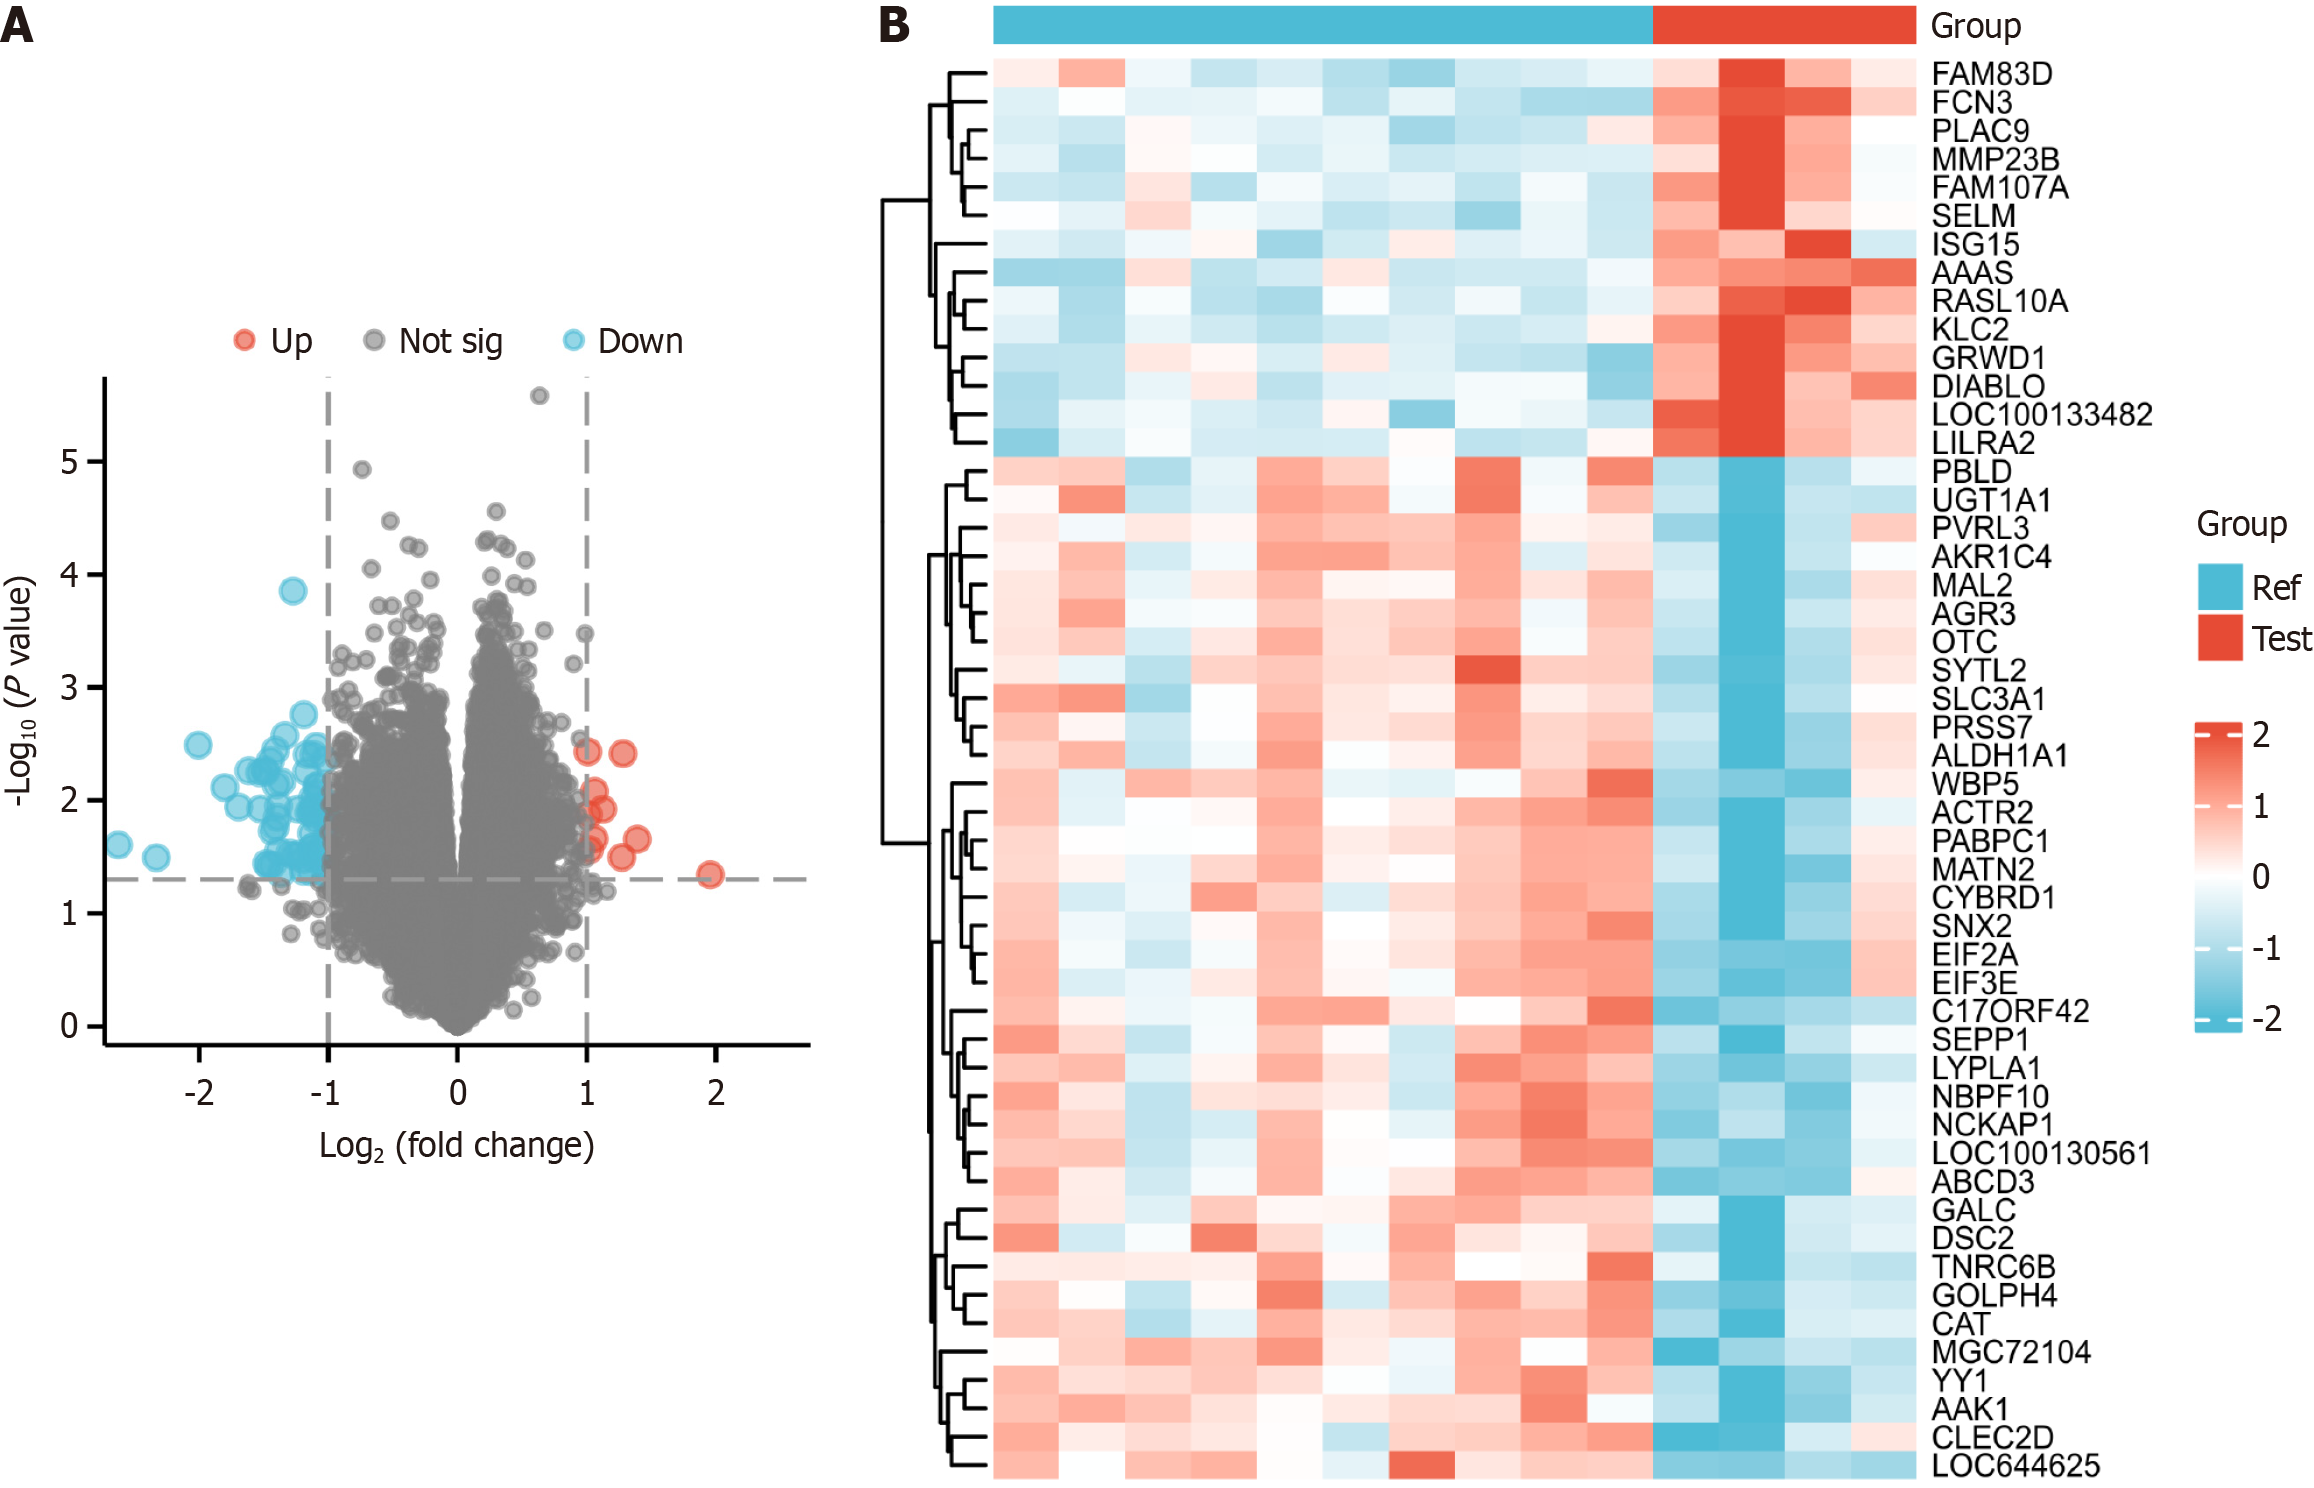
Figure 1 Data processing and differentially expressed gene identification.
A: Heatmap of sample-to-sample correlation. The diabetes group displayed a stronger intragroup correlation than the control group; B: Volcano plot generated using the limma R tool, showcasing all differentially expressed genes in the control and diabetes groups.
- Citation: Lu M, Guo XW, Zhang FF, Wu DH, Xie D, Luo FQ. Dexmedetomidine ameliorates diabetic intestinal injury by promoting the polarization of M2 macrophages through the MMP23B pathway. World J Diabetes 2024; 15(9): 1962-1978
- URL: https://www.wjgnet.com/1948-9358/full/v15/i9/1962.htm
- DOI: https://dx.doi.org/10.4239/wjd.v15.i9.1962


