Copyright
©The Author(s) 2024.
World J Diabetes. Sep 15, 2024; 15(9): 1942-1961
Published online Sep 15, 2024. doi: 10.4239/wjd.v15.i9.1942
Published online Sep 15, 2024. doi: 10.4239/wjd.v15.i9.1942
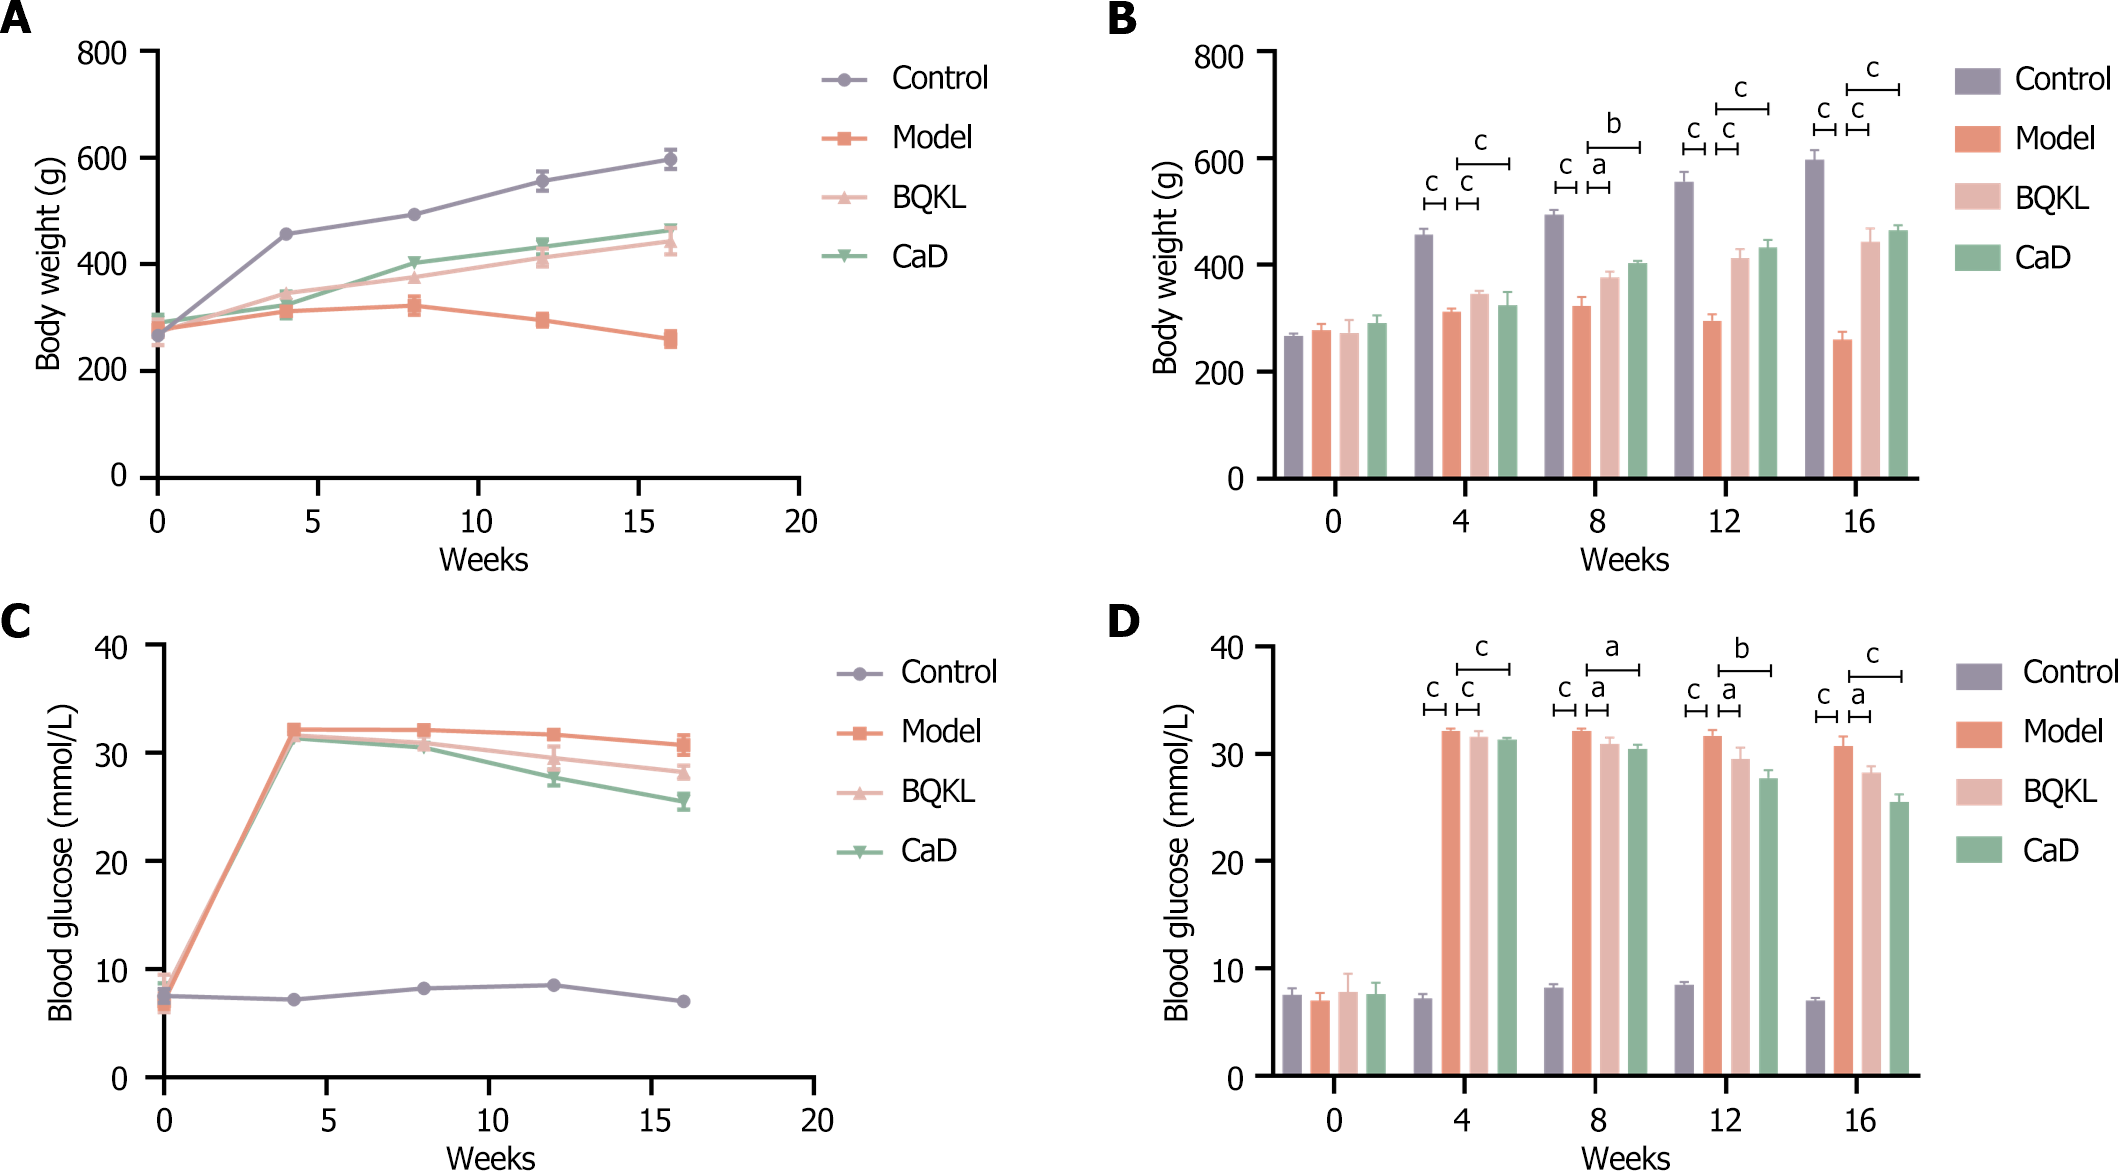
Figure 5 Changes in body weight and blood sugar at different time points.
A: Body weight at different time points; B: Blood glucose at different time points. The sequence from left to right represents the control group, the model group, the BQKL group and the CaD group. aP < 0.05, bP < 0.01, cP < 0.001. BQKL: Buqing granule; CaD: Calcium dobesilate.
- Citation: Yang YF, Yuan L, Li XY, Liu Q, Jiang WJ, Jiao TQ, Li JQ, Ye MY, Niu Y, Nan Y. Molecular mechanisms of Buqing granule for the treatment of diabetic retinopathy: Network pharmacology analysis and experimental validation. World J Diabetes 2024; 15(9): 1942-1961
- URL: https://www.wjgnet.com/1948-9358/full/v15/i9/1942.htm
- DOI: https://dx.doi.org/10.4239/wjd.v15.i9.1942


