Copyright
©The Author(s) 2024.
World J Diabetes. Sep 15, 2024; 15(9): 1916-1931
Published online Sep 15, 2024. doi: 10.4239/wjd.v15.i9.1916
Published online Sep 15, 2024. doi: 10.4239/wjd.v15.i9.1916
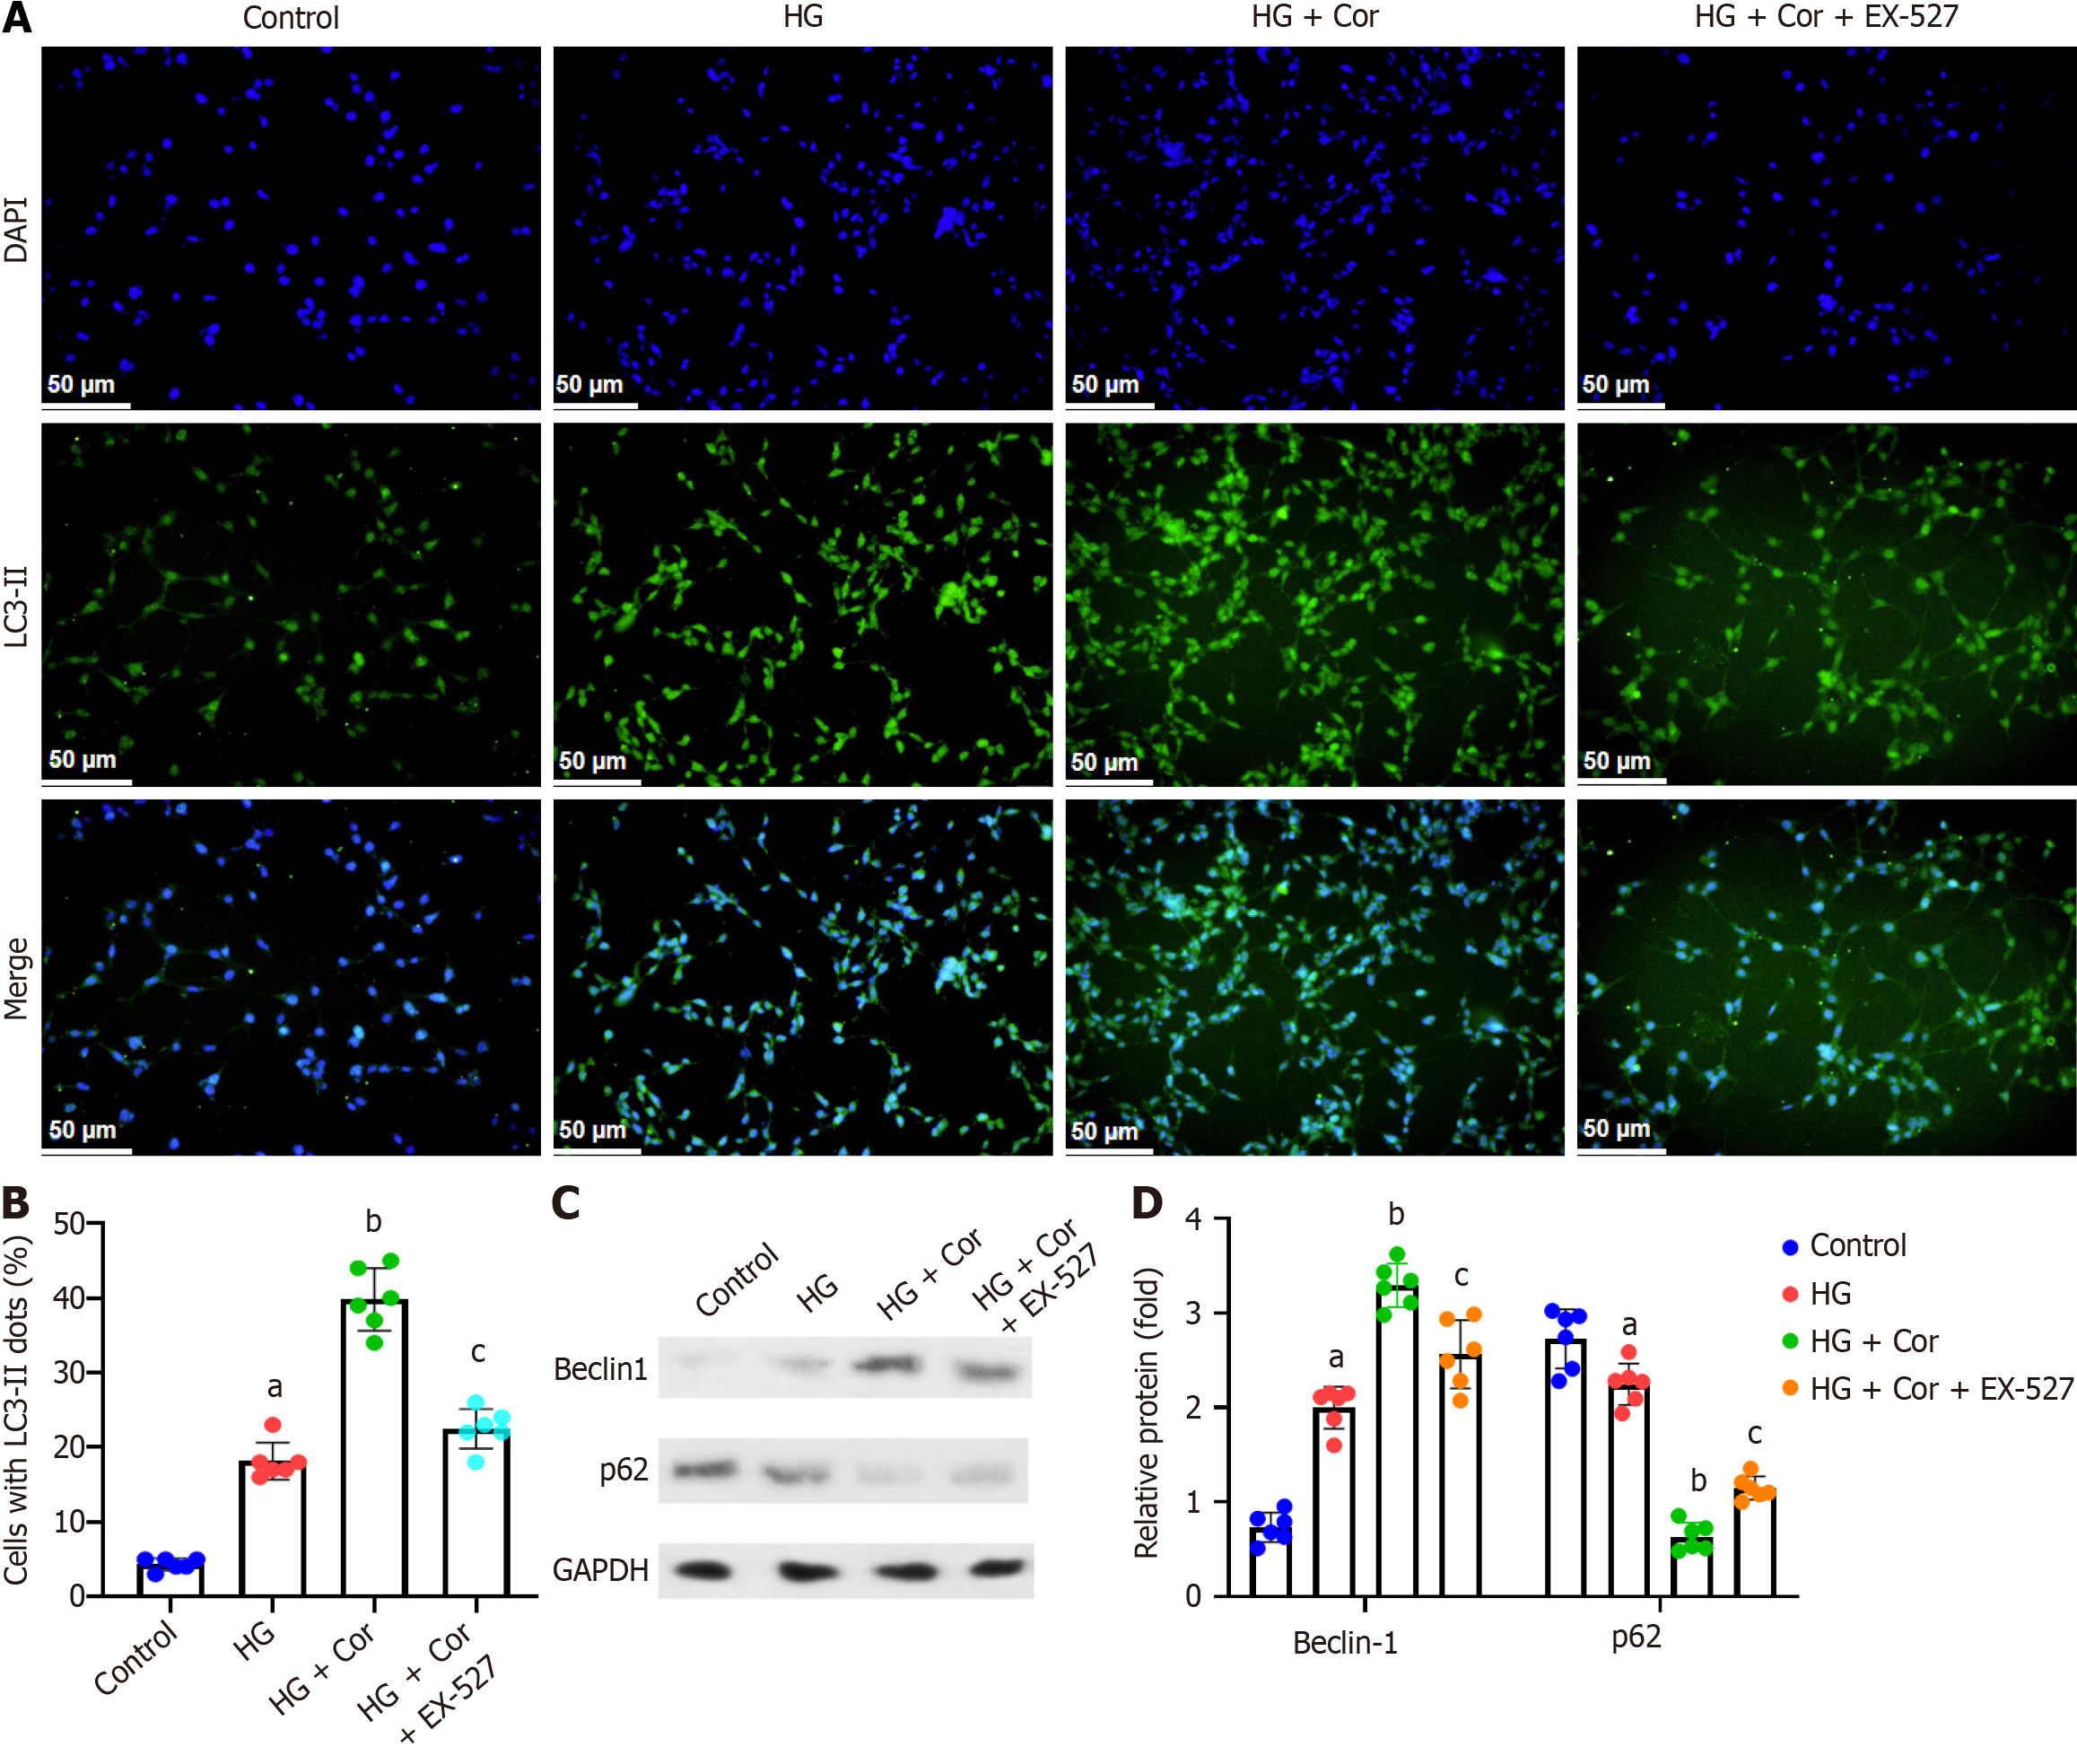
Figure 8 Corilagin promotes hyperglycemia-induced podocyte autophagy via SIRT1.
A: Cells were stained for LC3-II and nuclei. The nuclei of surviving cells were stained with DAPI and showed blue fluorescence. The cytoplasm of autophagic cells was stained for LC3-II and shows green fluorescence; B: Quantitative analysis of autophagic cells in each group; C: Real-time quantitative PCR was performed to determine the expression of autophagy-related proteins; D: Quantification analysis of LC3 II and p62 protein bands normalized to GAPDH. Data are presented as the mean ± SD. aP < 0.001 vs control group; bP < 0.001 vs HG group; cP < 0.001 vs HG + Cor group. HG: High glucose; Cor: Corilagin.
- Citation: Lou Y, Luan YT, Rong WQ, Gai Y. Corilagin alleviates podocyte injury in diabetic nephropathy by regulating autophagy via the SIRT1-AMPK pathway. World J Diabetes 2024; 15(9): 1916-1931
- URL: https://www.wjgnet.com/1948-9358/full/v15/i9/1916.htm
- DOI: https://dx.doi.org/10.4239/wjd.v15.i9.1916


