Copyright
©The Author(s) 2024.
World J Diabetes. Sep 15, 2024; 15(9): 1916-1931
Published online Sep 15, 2024. doi: 10.4239/wjd.v15.i9.1916
Published online Sep 15, 2024. doi: 10.4239/wjd.v15.i9.1916
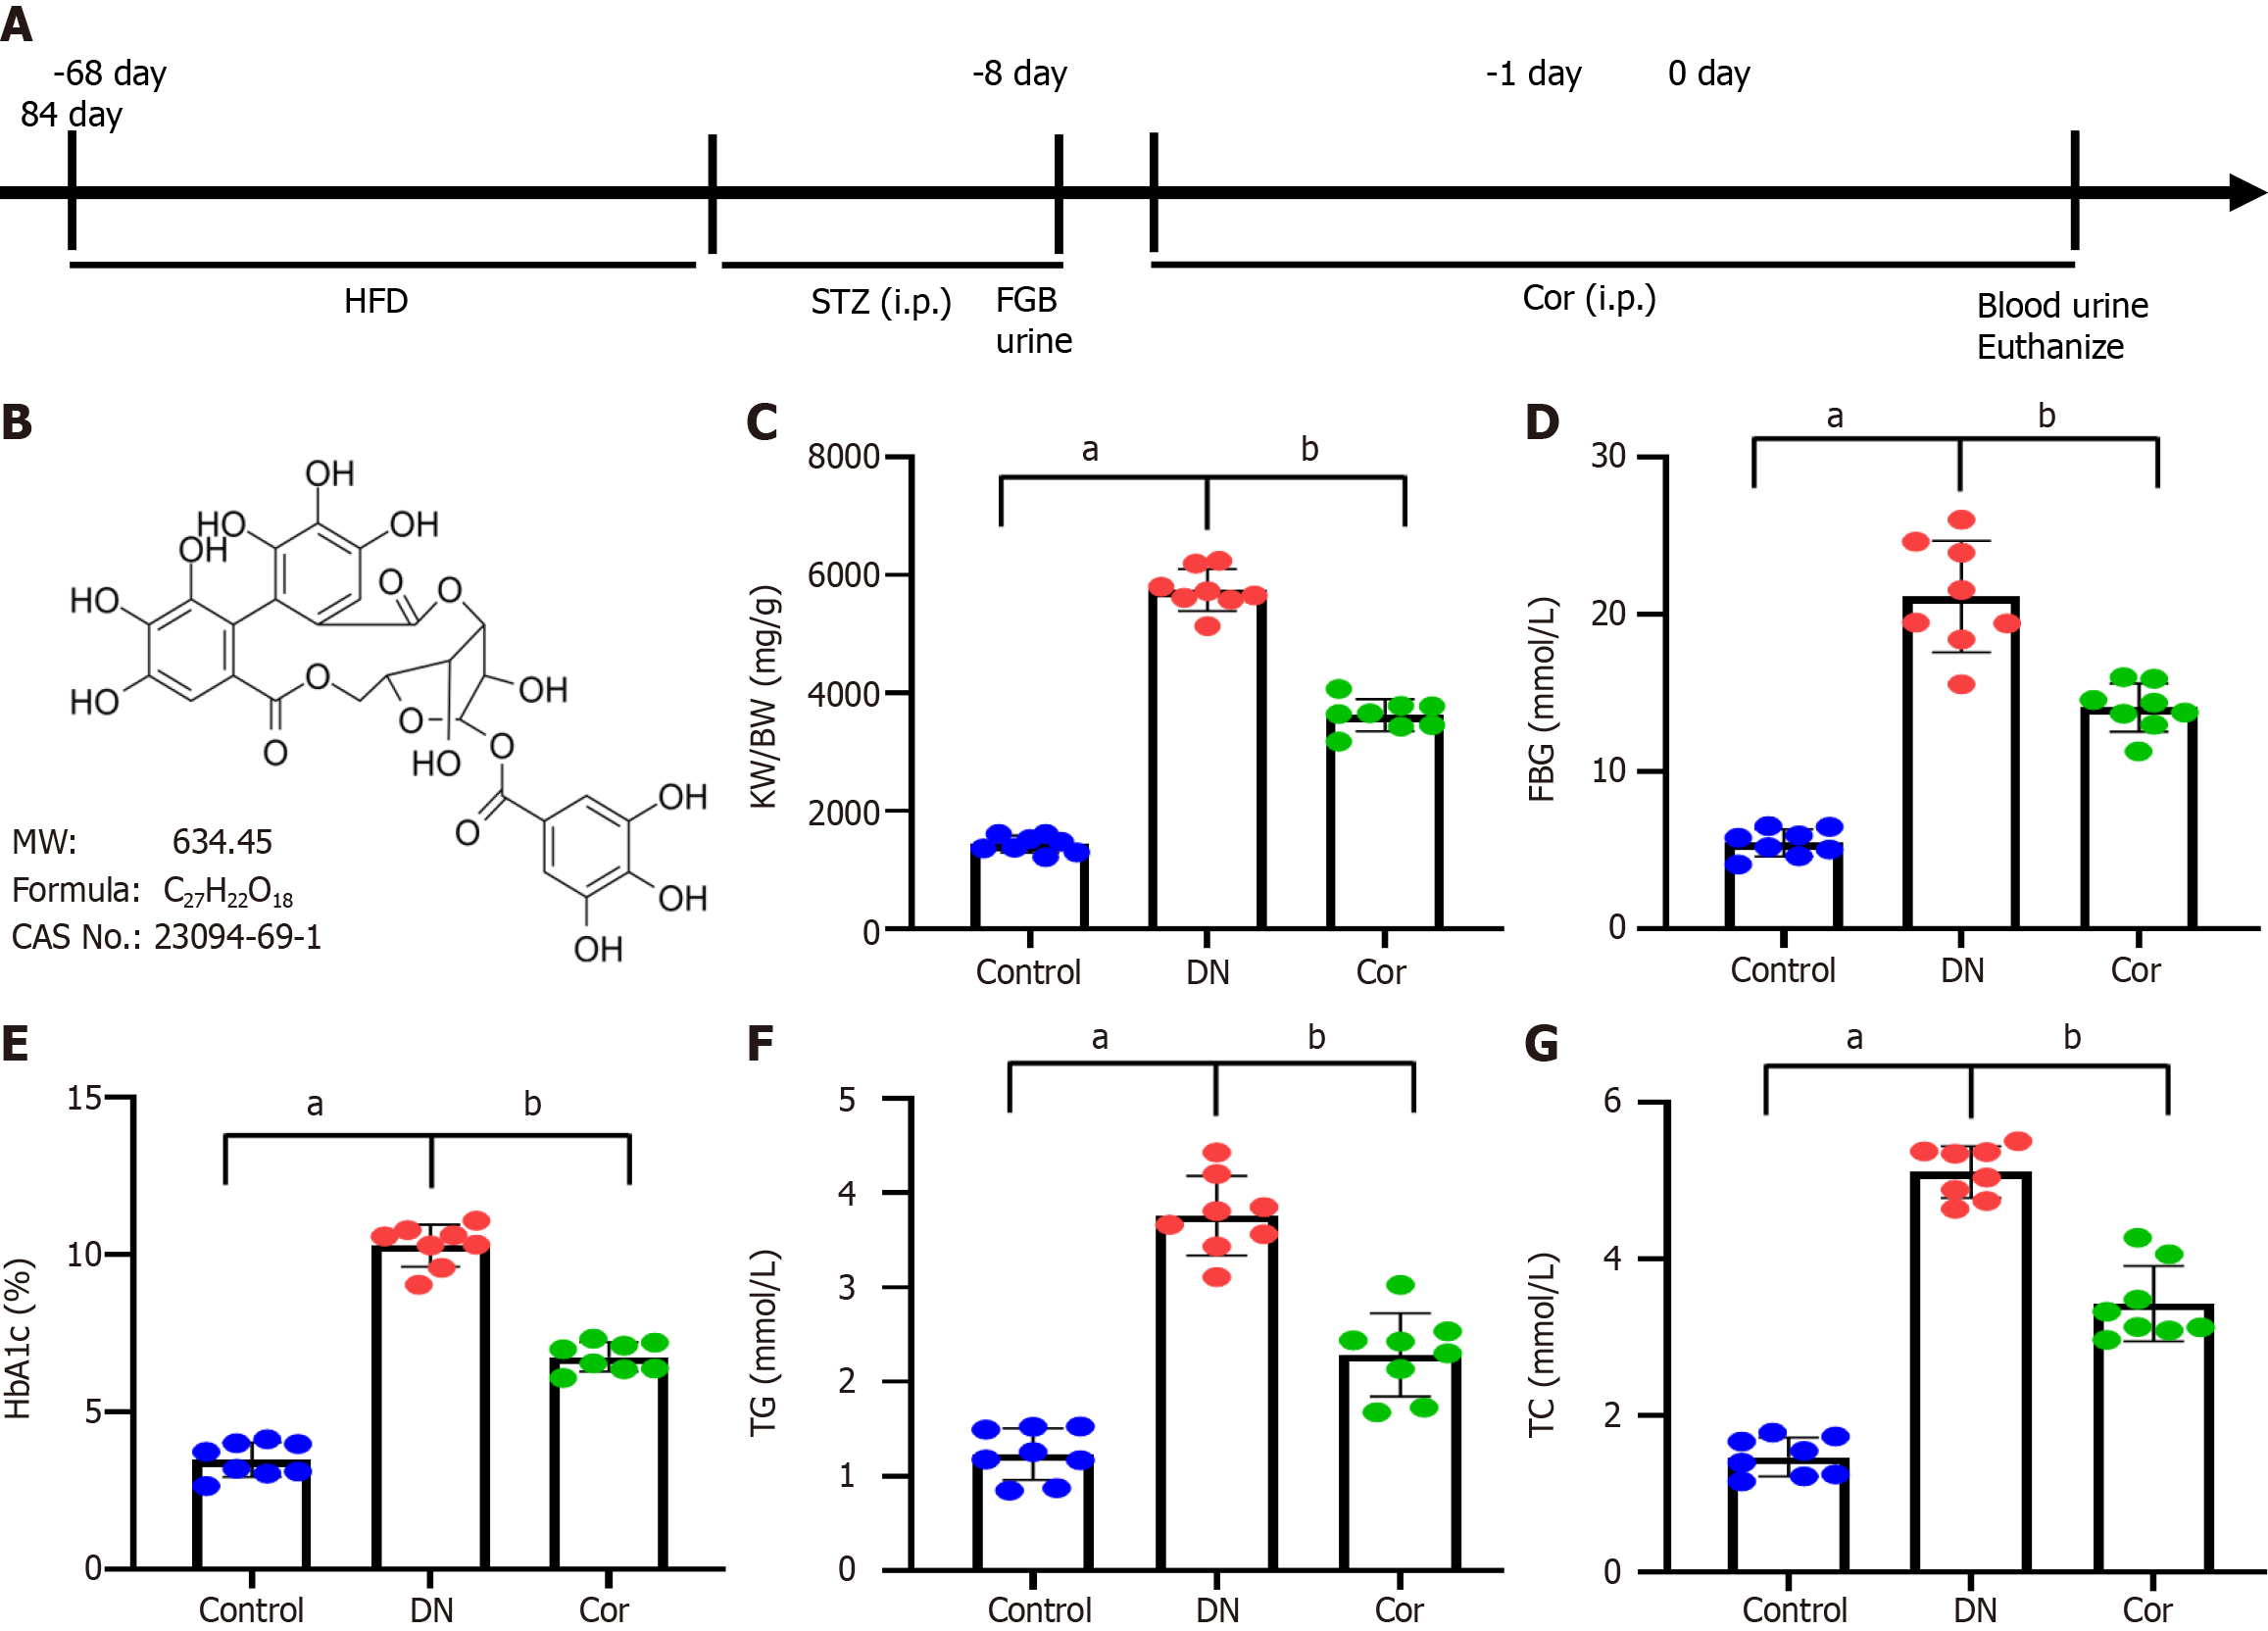
Figure 1 Effects of corilagin on blood glucose and lipids in diabetic mice.
A: Timeline of procedure for corilagin (Cor) intervention; B: Structural formula, molecular weight, chemical formula, and CAS number of Cor. A diabetic nephropathy mouse model was induced by high-fat diet feeding followed by streptozotocin injections. Cor was intraperitoneally injected (30 mg/kg/d) for 12 wk; C: Renal hypertrophy index kidney weight (KW)/body weight (BW) was calculated from KW (mg) divided by BW (g); D: Fasting blood glucose (mmol/L) detected with a glucose meter; E: ELISA analysis of glycosylated hemoglobin (%); F and G: Triglycerides and total cholesterol detected by the GPO-PAP colourimetric method. Data are presented as the mean ± SD (n = 8 in each group). Data were analyzed using one-way ANOVA, and the Bonferroni test was used for the post hoc test. aP < 0.001 vs control group; bP < 0.001 vs DN group. Cor: Corilagin; DN: Diabetic nephropathy; HFD: High-fat diet; FBG: Fasting blood glucose; TG: Triglycerides; TC: Total cholesterol.
- Citation: Lou Y, Luan YT, Rong WQ, Gai Y. Corilagin alleviates podocyte injury in diabetic nephropathy by regulating autophagy via the SIRT1-AMPK pathway. World J Diabetes 2024; 15(9): 1916-1931
- URL: https://www.wjgnet.com/1948-9358/full/v15/i9/1916.htm
- DOI: https://dx.doi.org/10.4239/wjd.v15.i9.1916


