Copyright
©The Author(s) 2024.
World J Diabetes. Aug 15, 2024; 15(8): 1778-1792
Published online Aug 15, 2024. doi: 10.4239/wjd.v15.i8.1778
Published online Aug 15, 2024. doi: 10.4239/wjd.v15.i8.1778
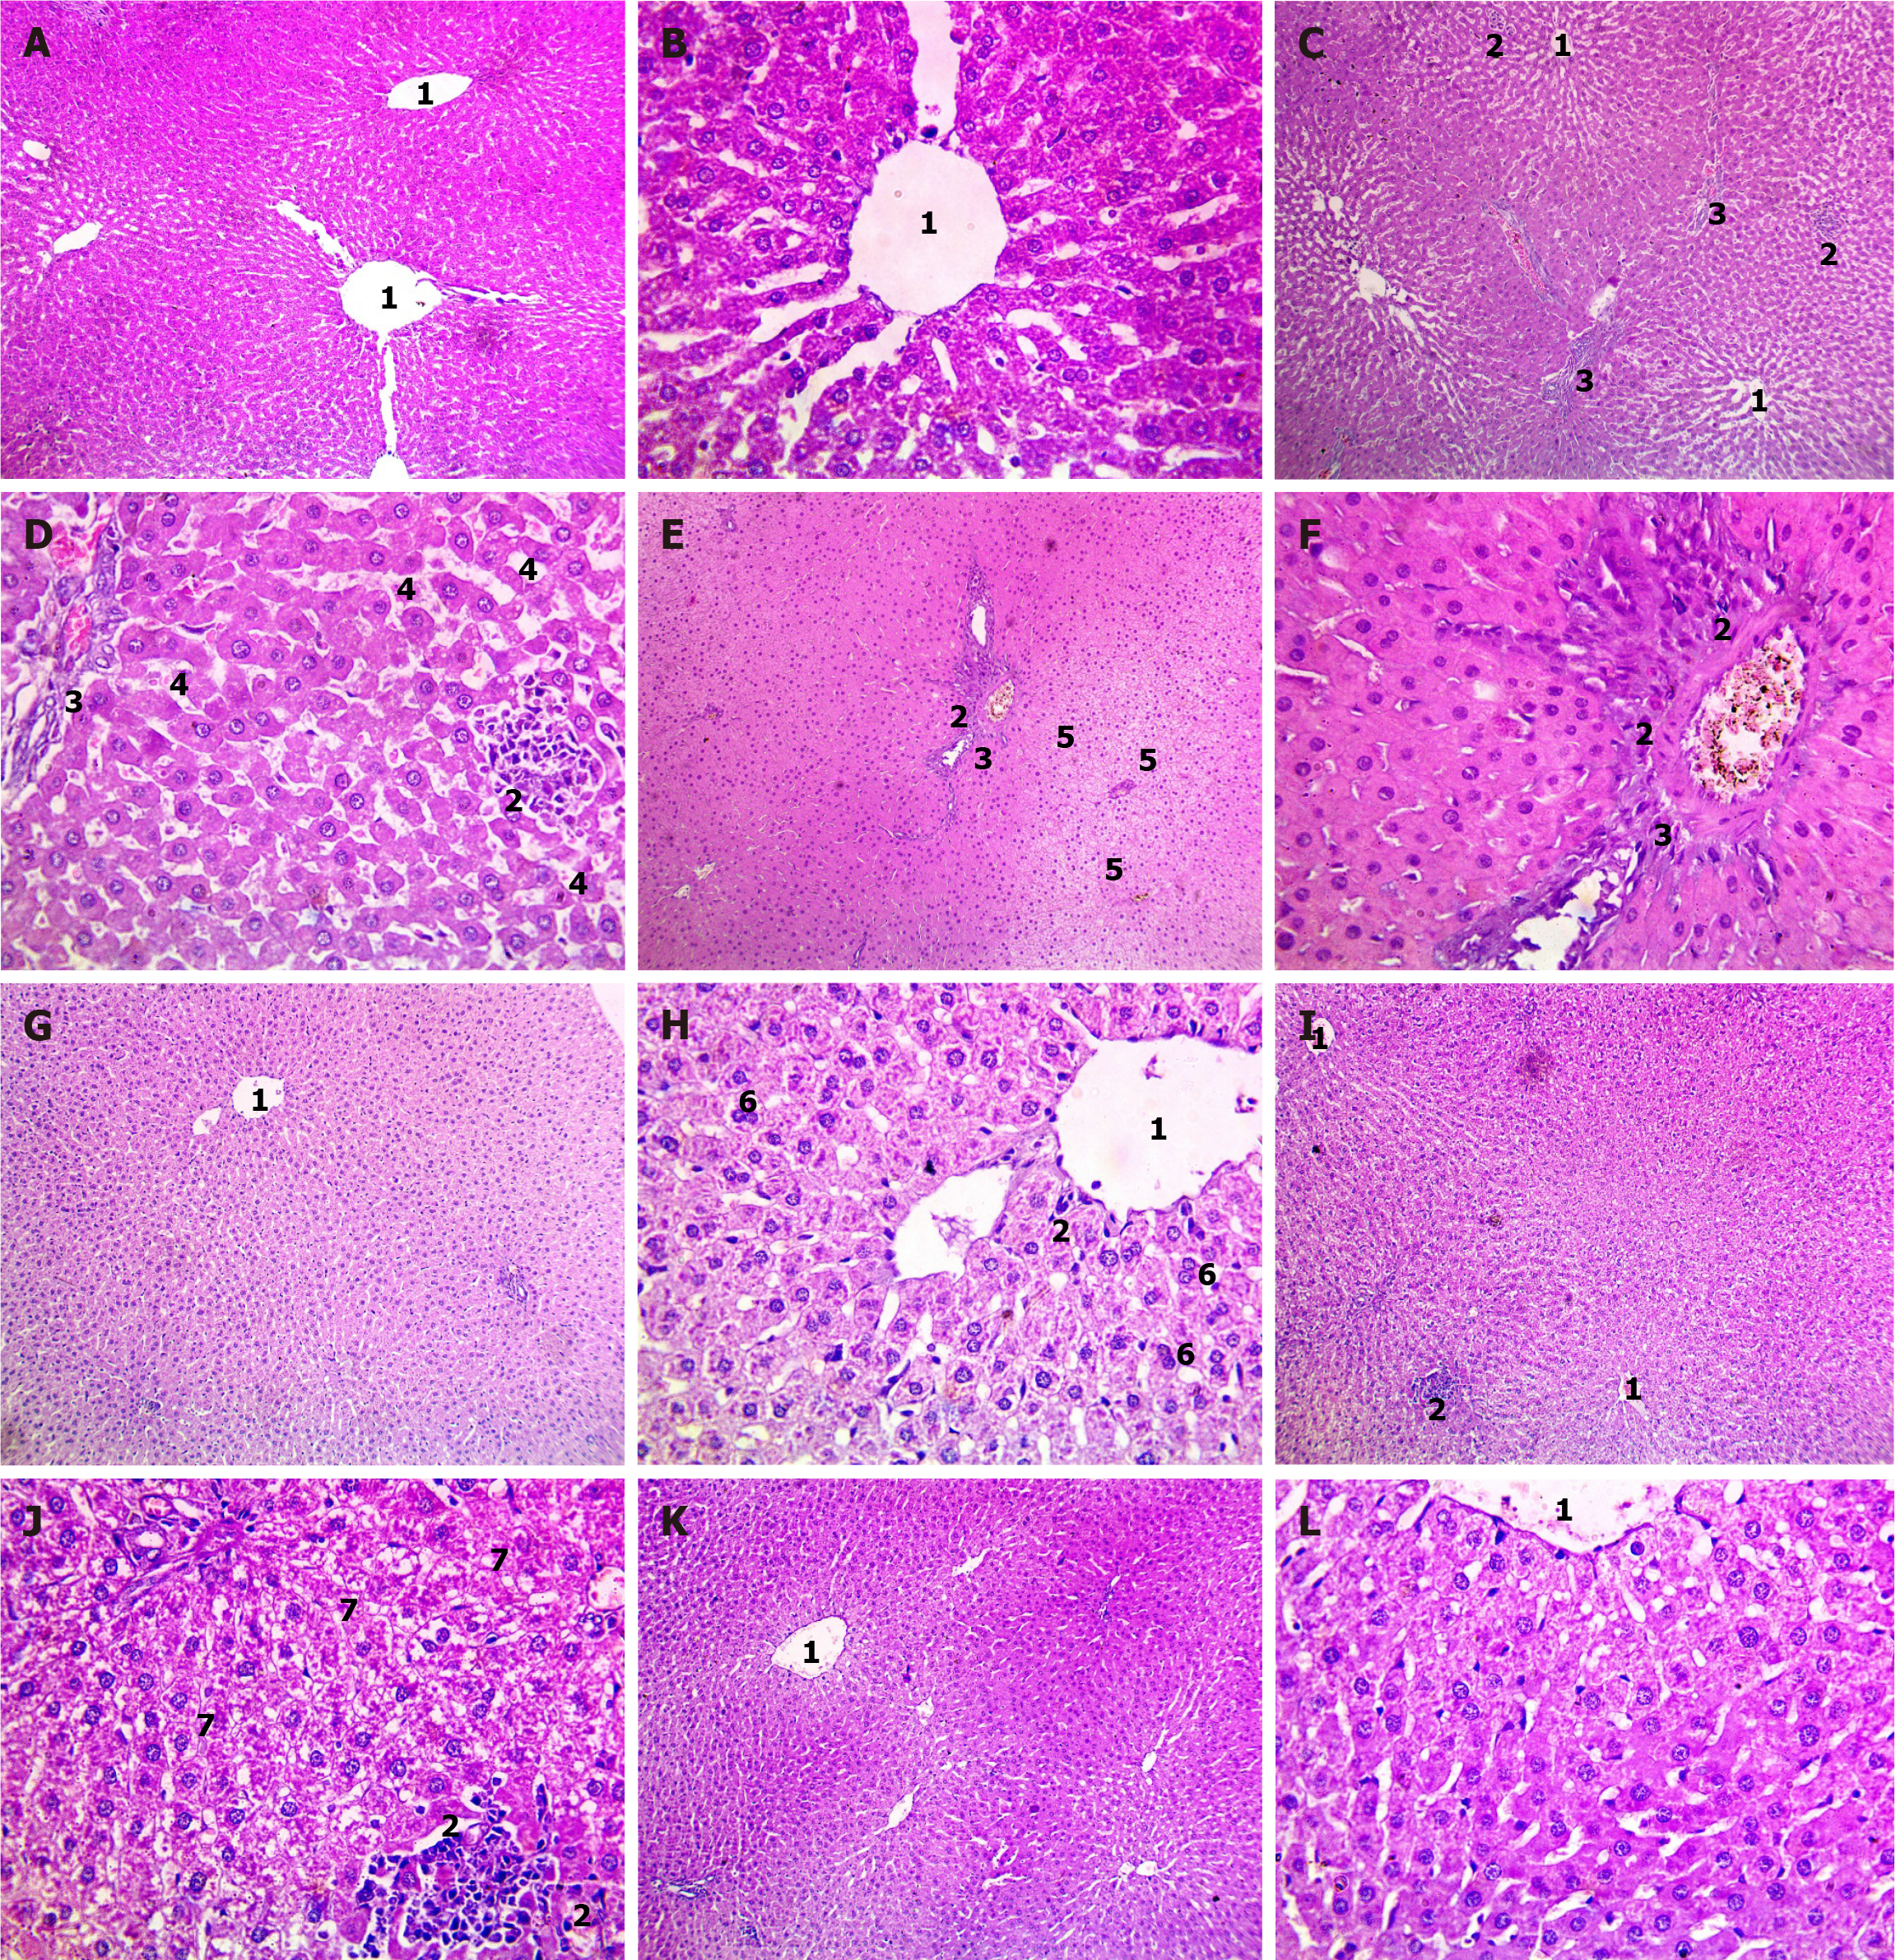
Figure 7 Examination of histopathological changes in rat liver sections using HE staining.
Photomicrographs of different magnifications showing pancreatic sections of the control group (A and B), Streptozotocin diabetic group (C and D), metformin (MET)-treated group (E and F), cholecalciferol (CHO) + MET-treated group (G and H), taurine (TAU) + MET-treated group (I and J), and TAU + CHO + MET-treated group (K and L). 1The central vein. 2Lobular inflammation. 3Fibrous portal expansion. 4Sinusoidal dilatation. 5Hydropic degeneration. 6Preserved hepatocyte arrangement with binucleation of some hepatocytes. 7Hydropic degeneration of hepatocytes with areas of necrosis indicated by lost nuclei.
- Citation: Attia MS, Ayman F, Attia MS, Yahya G, Zahra MH, Khalil MMI, Diab AAA. Mitigating diabetes-related complications: Empowering metformin with cholecalciferol and taurine supplementation in type 2 diabetic rats. World J Diabetes 2024; 15(8): 1778-1792
- URL: https://www.wjgnet.com/1948-9358/full/v15/i8/1778.htm
- DOI: https://dx.doi.org/10.4239/wjd.v15.i8.1778


