Copyright
©The Author(s) 2024.
World J Diabetes. Aug 15, 2024; 15(8): 1778-1792
Published online Aug 15, 2024. doi: 10.4239/wjd.v15.i8.1778
Published online Aug 15, 2024. doi: 10.4239/wjd.v15.i8.1778
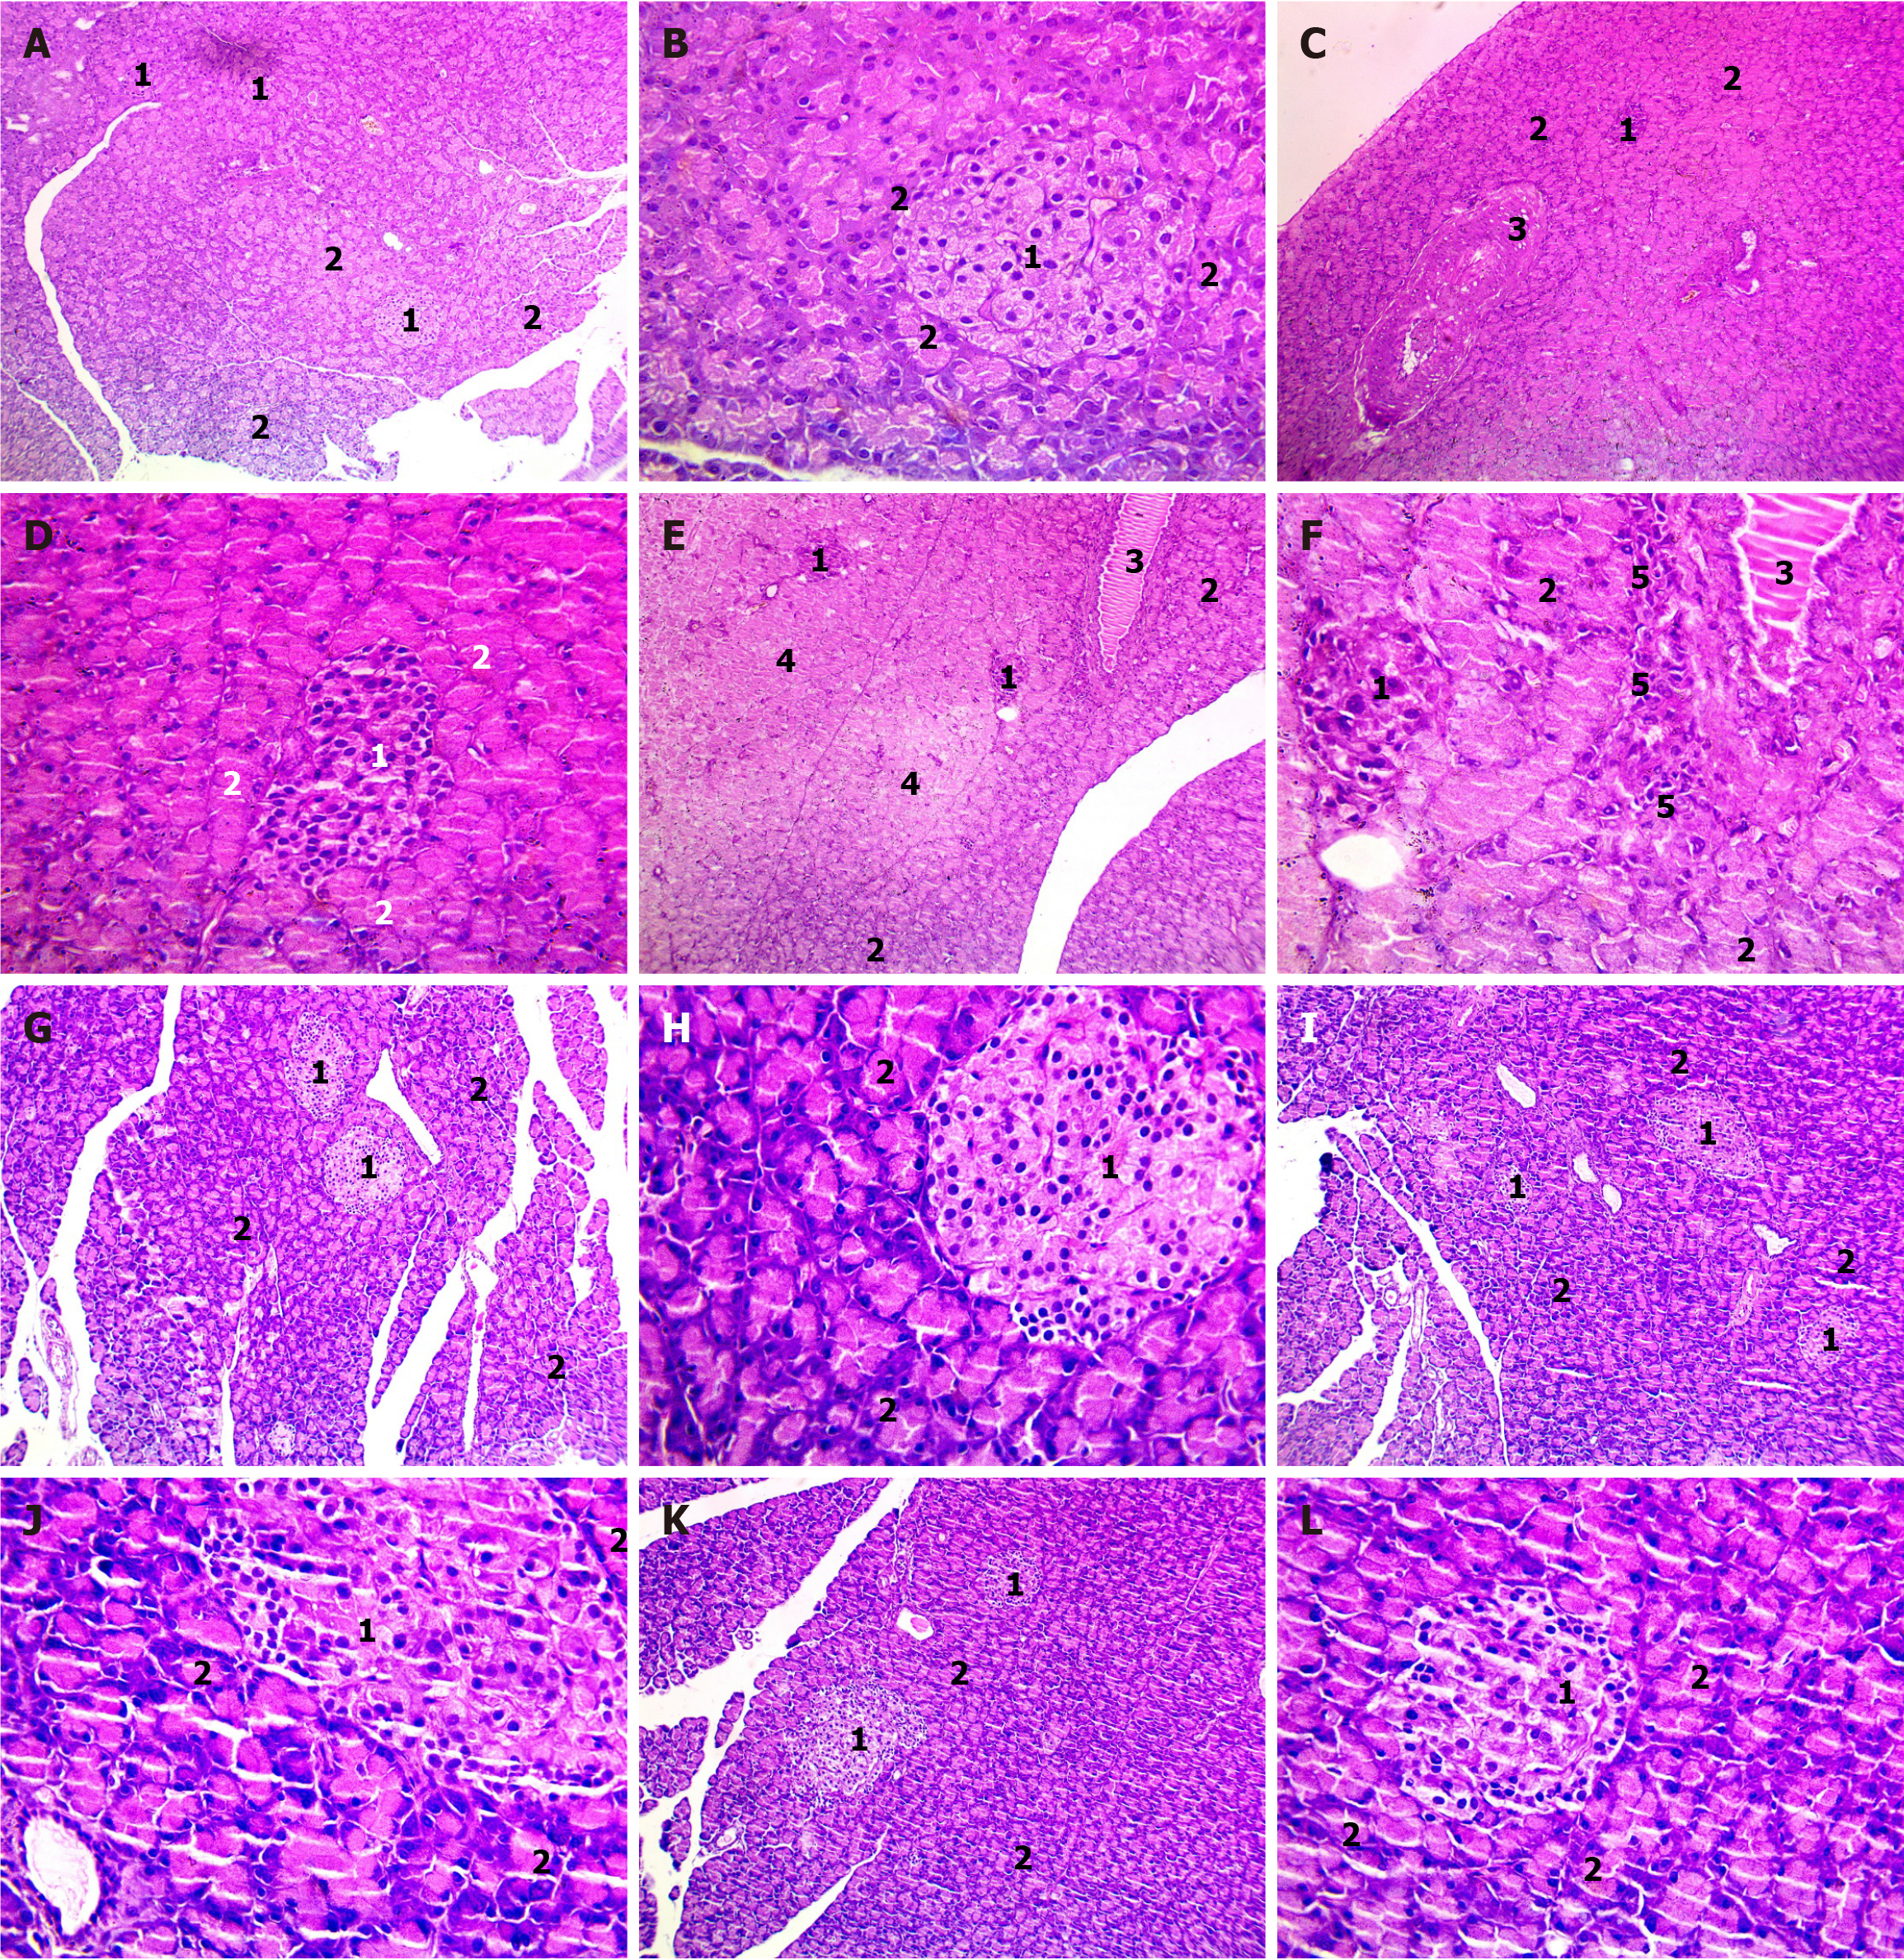
Figure 6 Examination of histopathological changes in rat pancreatic sections using HandE staining.
A-I: Photomicrographs of different magnifications showing pancreatic sections of control group (A and B), Streptozotocin diabetic group (C and D), metformin (MET)-treated group (E and F), cholecalciferol (CHO) + MET-treated group (G and H), taurine (TAU) + MET-treated group (I and J), and TAU + CHO + MET-treated group (K and L). 1Normal structure of the islet of Langerhans. 2Normal structure of acinar cells. 3Normal structure of a thickened blood vessel. 4Normal structure of areas of degenerative changes in acinar cells. 5Normal structure of perivascular inflammation.
- Citation: Attia MS, Ayman F, Attia MS, Yahya G, Zahra MH, Khalil MMI, Diab AAA. Mitigating diabetes-related complications: Empowering metformin with cholecalciferol and taurine supplementation in type 2 diabetic rats. World J Diabetes 2024; 15(8): 1778-1792
- URL: https://www.wjgnet.com/1948-9358/full/v15/i8/1778.htm
- DOI: https://dx.doi.org/10.4239/wjd.v15.i8.1778


