Copyright
©The Author(s) 2024.
World J Diabetes. Aug 15, 2024; 15(8): 1778-1792
Published online Aug 15, 2024. doi: 10.4239/wjd.v15.i8.1778
Published online Aug 15, 2024. doi: 10.4239/wjd.v15.i8.1778
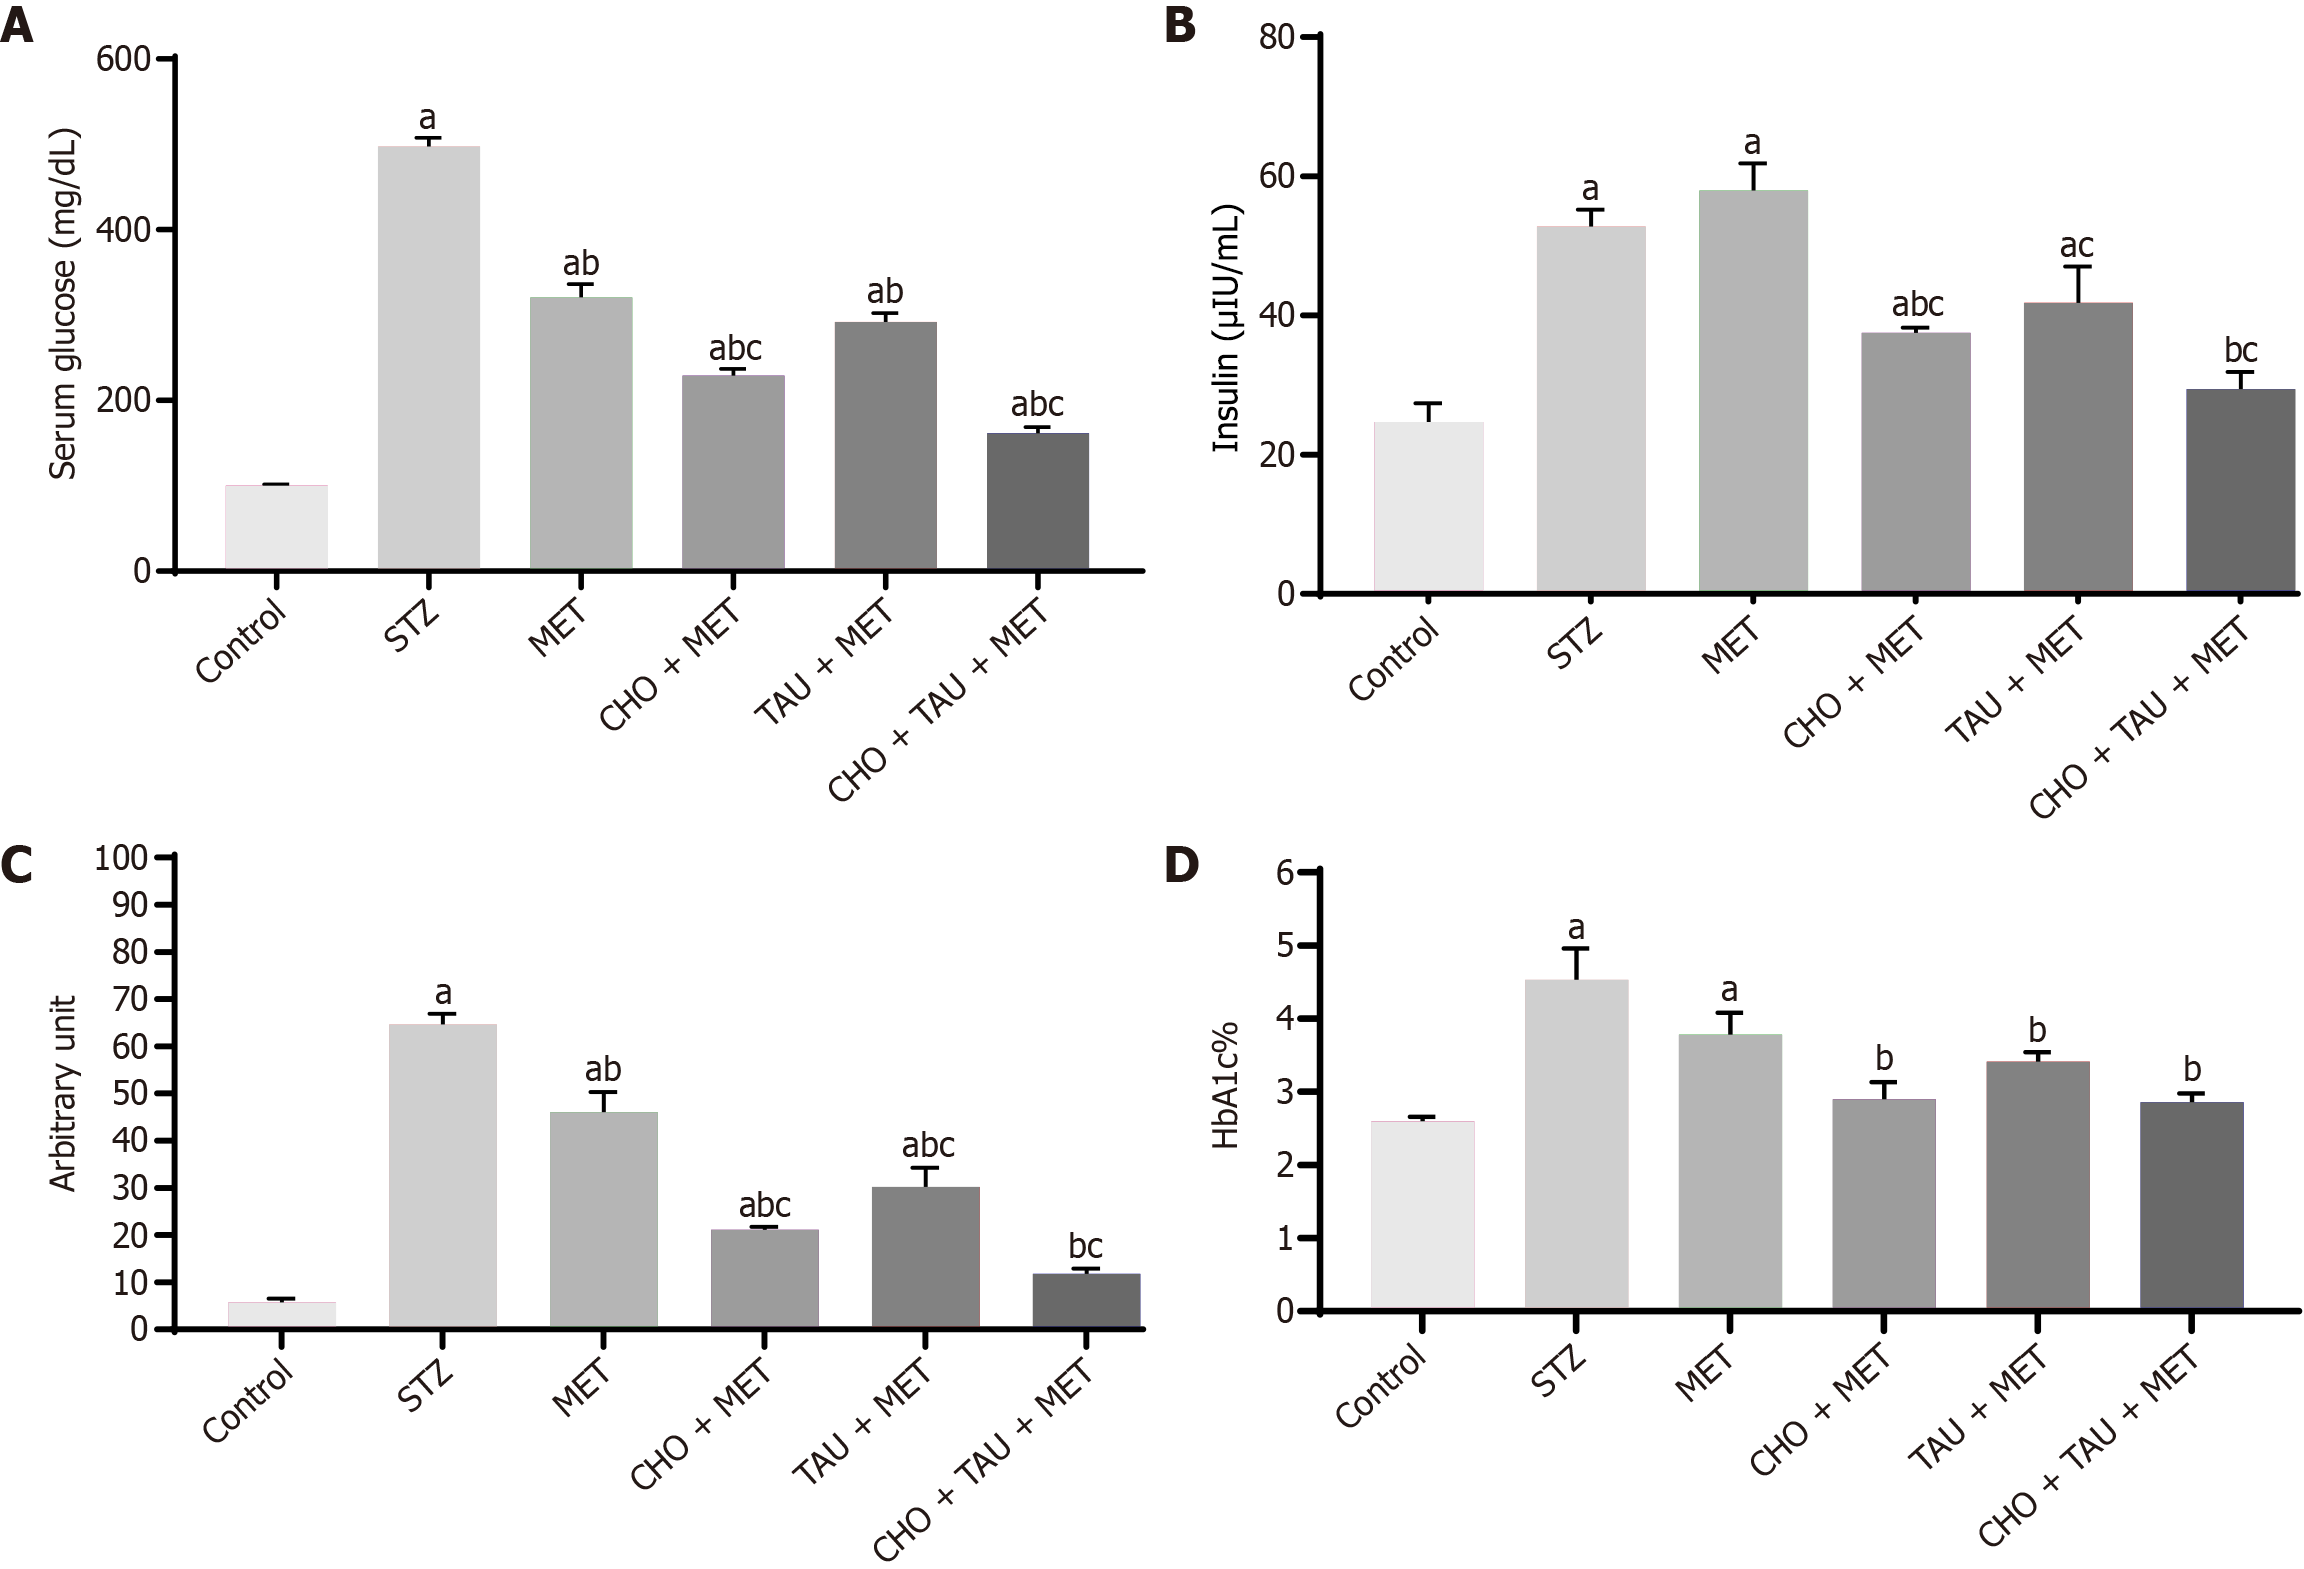
Figure 2 Assessment of glycemic profiles.
A-D: Measurement of serum glucose level (A), insulin level (B), Homeostasis Model Assessment of Insulin Resistance levels (C), glycated hemoglobin% (D) in the control group and other experimental groups. The data, presented as means ± SE (n = 6), indicate significant differences at P < 0.05. STZ: Streptozotocin; MET: Metformin; CHO: Cholecalciferol; TAU: Taurine; HbA1c: Glycated hemoglobin. aSignificance compared to the control group. bSignificance compared to the Streptozotocin diabetic group. cSignificance compared to the metformin-treated group.
- Citation: Attia MS, Ayman F, Attia MS, Yahya G, Zahra MH, Khalil MMI, Diab AAA. Mitigating diabetes-related complications: Empowering metformin with cholecalciferol and taurine supplementation in type 2 diabetic rats. World J Diabetes 2024; 15(8): 1778-1792
- URL: https://www.wjgnet.com/1948-9358/full/v15/i8/1778.htm
- DOI: https://dx.doi.org/10.4239/wjd.v15.i8.1778


