Copyright
©The Author(s) 2024.
World J Diabetes. Aug 15, 2024; 15(8): 1753-1763
Published online Aug 15, 2024. doi: 10.4239/wjd.v15.i8.1753
Published online Aug 15, 2024. doi: 10.4239/wjd.v15.i8.1753
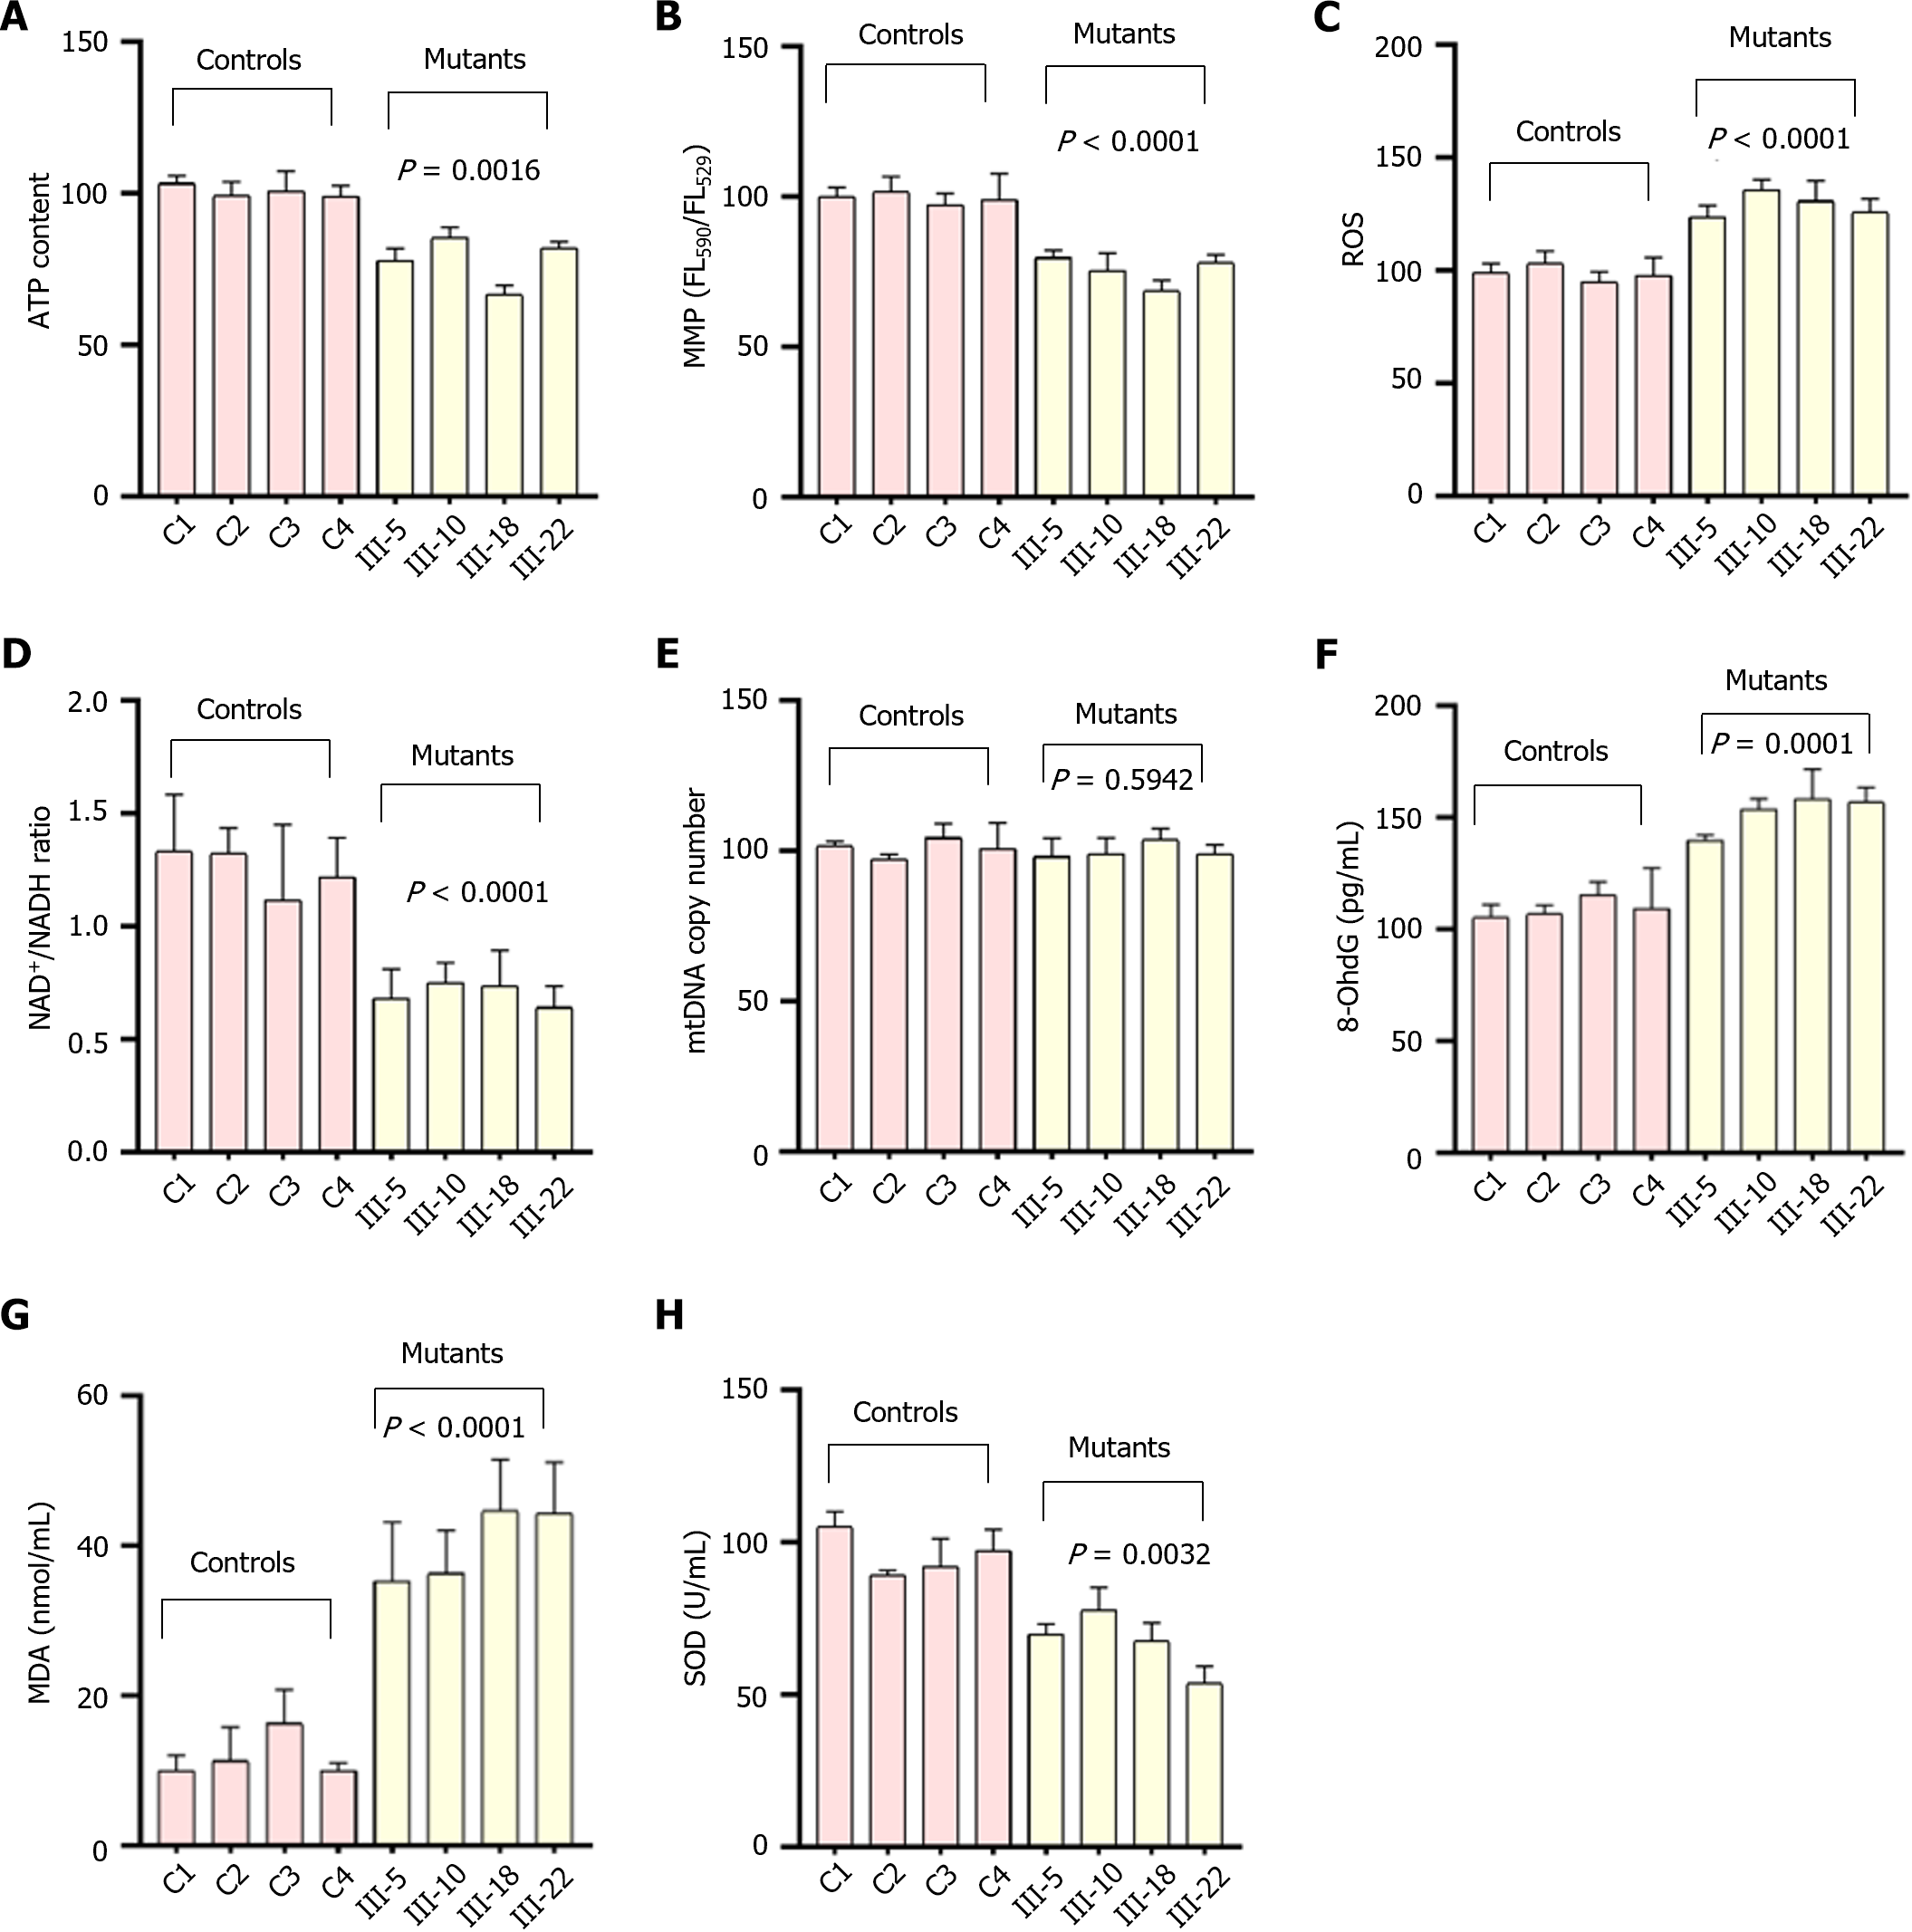
Figure 3 Analysis of mitochondrial functions in mutant and control cybrids.
A: Adenosine triphosphate analysis; B: Mitochondrial membrane potential levels; C: Reactive oxygen species analysis; D: Nicotinamide adenine dinucleotide/NADH ratio; E: Mitochondrial DNA copy number; F: 8-hydroxy-deoxyguanine levels; G: Malondialdehyde levels; H: Superoxide dismutase levels. ATP: Adenosine triphosphate; MMP: Mitochondrial membrane potential; ROS: Reactive oxygen species; NAD: Nicotinamide adenine dinucleotide; mtDNA: Mitochondrial DNA; 8-OhdG: 8-hydroxy-deoxyguanine; MDA: Malondialdehyde; SOD: Superoxide dismutase.
- Citation: Ding Y, Yu XJ, Guo QX, Leng JH. Functional analysis of the novel mitochondrial tRNATrp and tRNASer(AGY) variants associated with type 2 diabetes mellitus. World J Diabetes 2024; 15(8): 1753-1763
- URL: https://www.wjgnet.com/1948-9358/full/v15/i8/1753.htm
- DOI: https://dx.doi.org/10.4239/wjd.v15.i8.1753


