Copyright
©The Author(s) 2024.
World J Diabetes. Jul 15, 2024; 15(7): 1627-1644
Published online Jul 15, 2024. doi: 10.4239/wjd.v15.i7.1627
Published online Jul 15, 2024. doi: 10.4239/wjd.v15.i7.1627
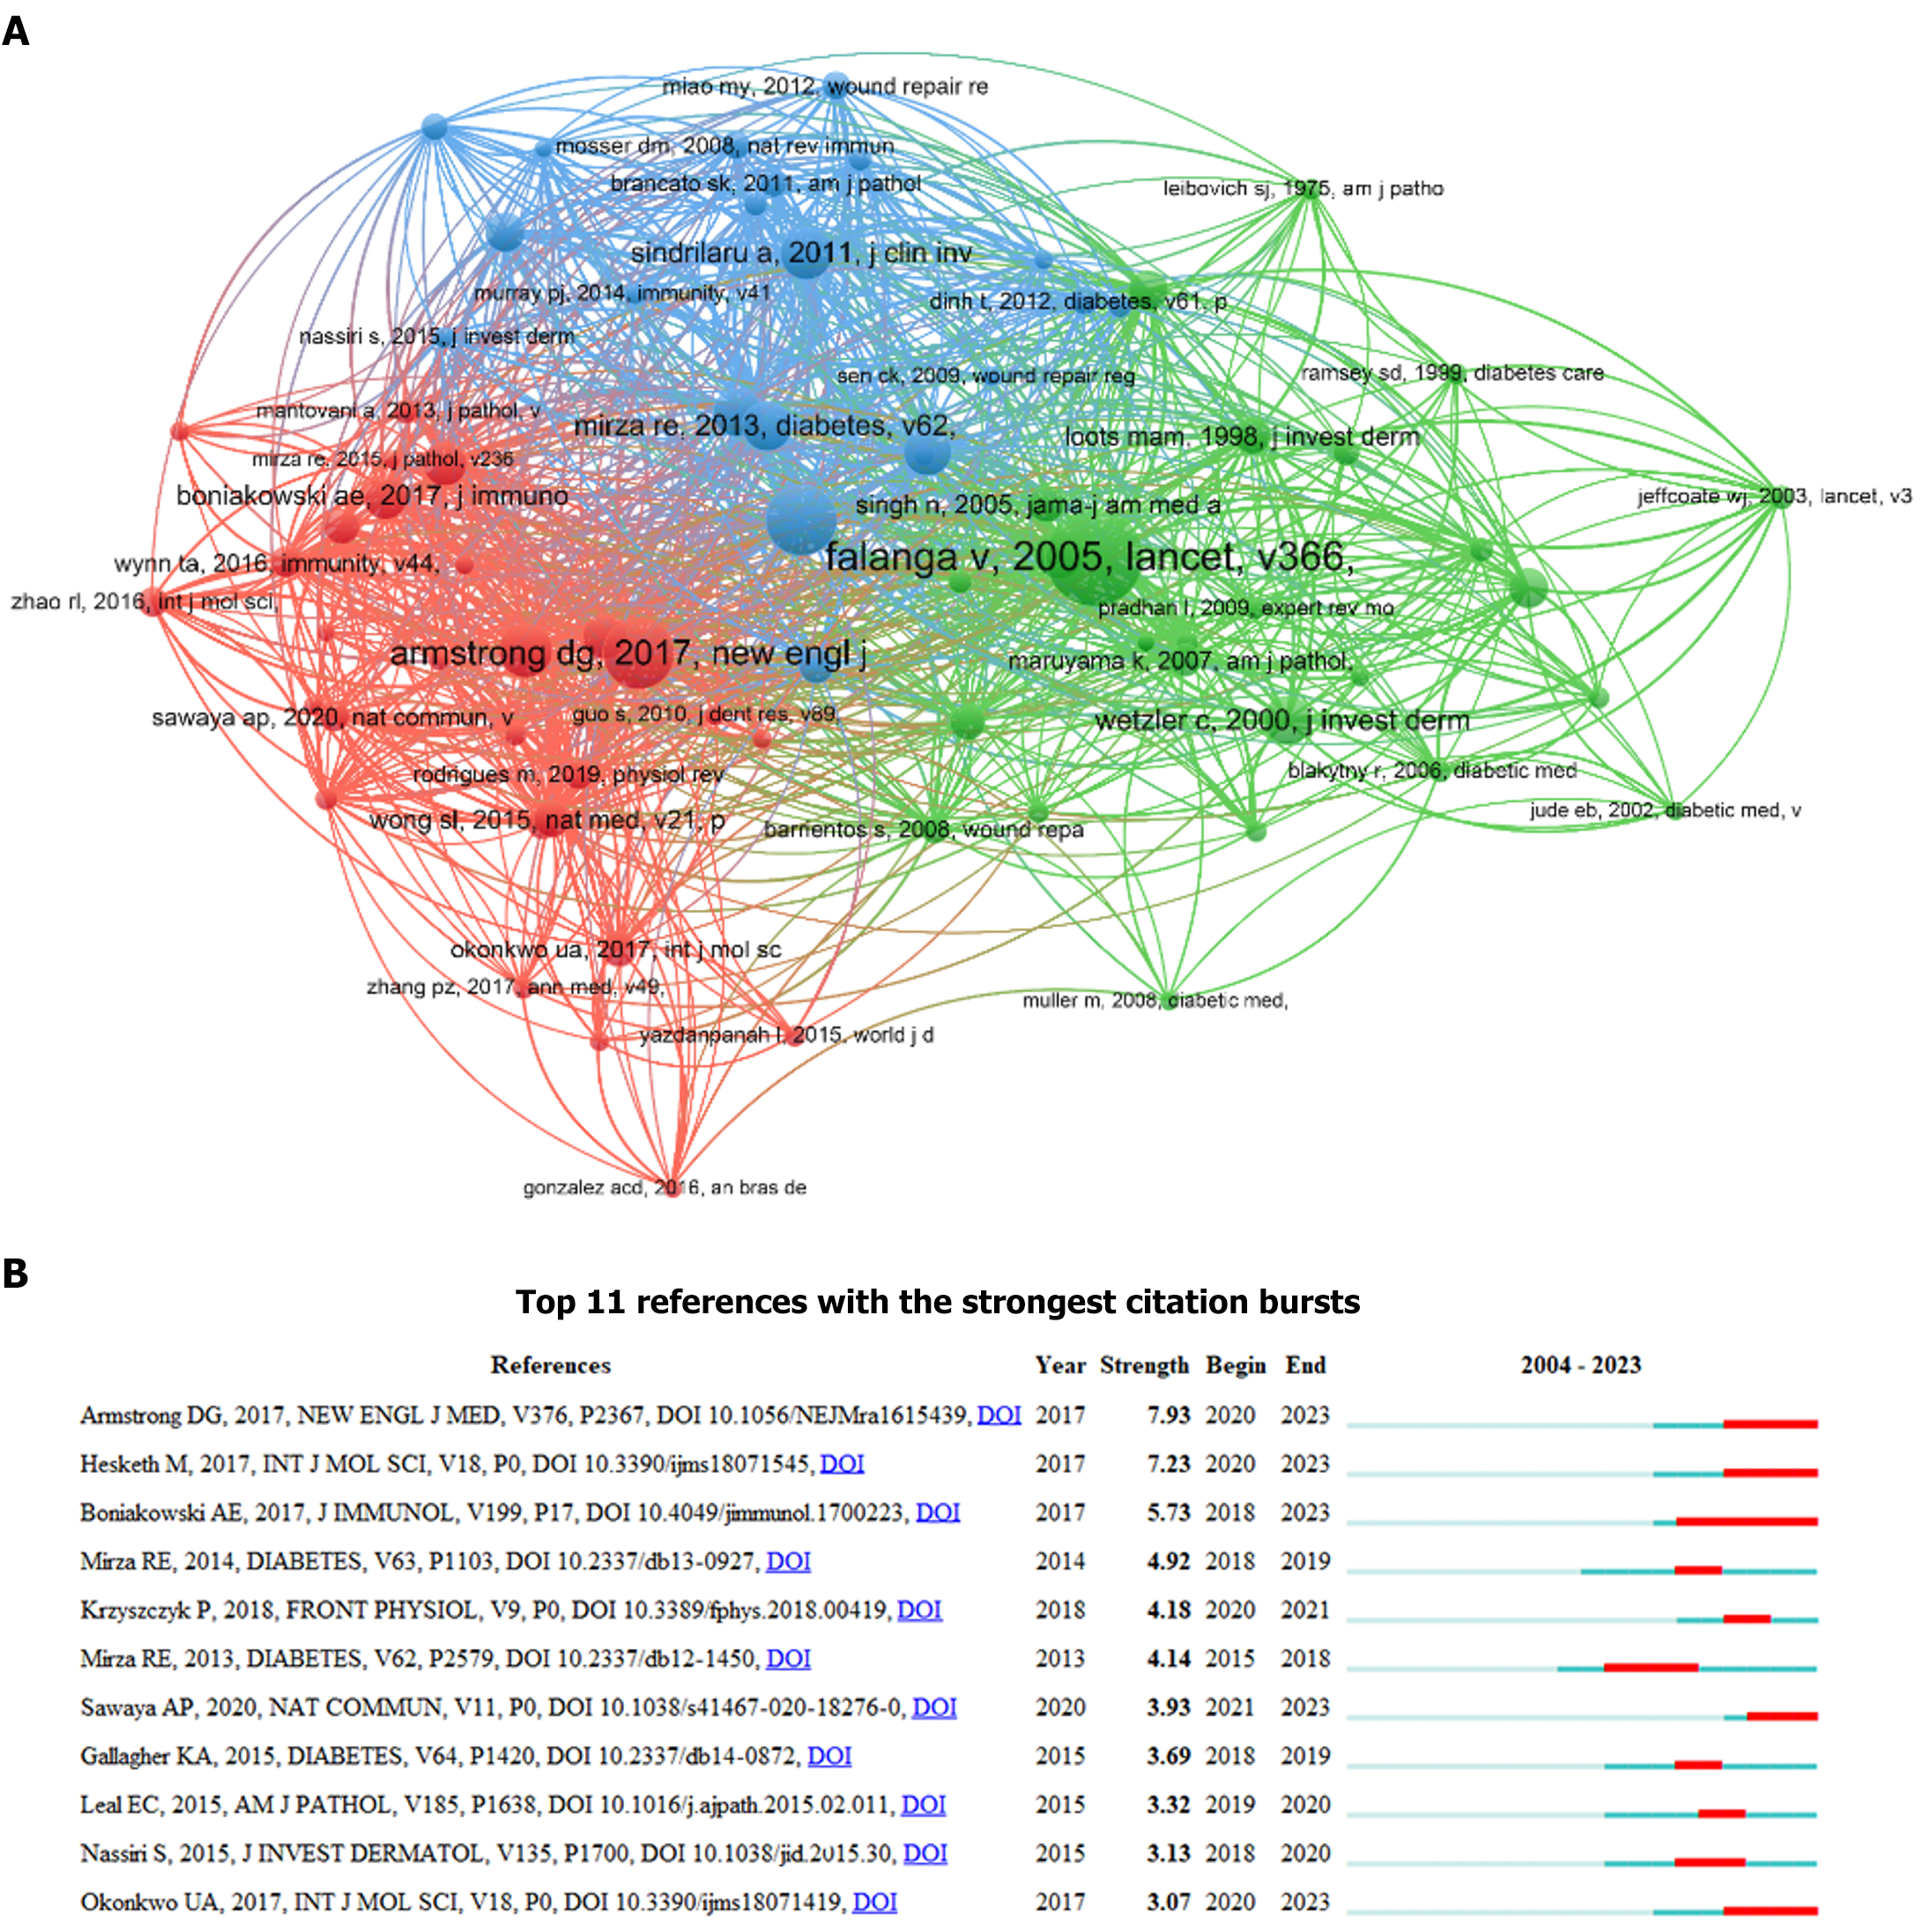
Figure 7 The co-citations network map of papers and top 11 references with the strongest citation bursts.
A: A node represents a reference, and the node size is proportional to the sum of co-citations (T = 10); B: References that were commonly cited are depicted by red bars, whereas references that were rarely cited are represented by blue bars.
- Citation: Wen JP, Ou SJ, Liu JB, Zhang W, Qu YD, Li JX, Xia CL, Yang Y, Qi Y, Xu CP. Global trends in publications regarding macrophages-related diabetic foot ulcers in the last two decades. World J Diabetes 2024; 15(7): 1627-1644
- URL: https://www.wjgnet.com/1948-9358/full/v15/i7/1627.htm
- DOI: https://dx.doi.org/10.4239/wjd.v15.i7.1627


