Copyright
©The Author(s) 2024.
World J Diabetes. Jul 15, 2024; 15(7): 1627-1644
Published online Jul 15, 2024. doi: 10.4239/wjd.v15.i7.1627
Published online Jul 15, 2024. doi: 10.4239/wjd.v15.i7.1627
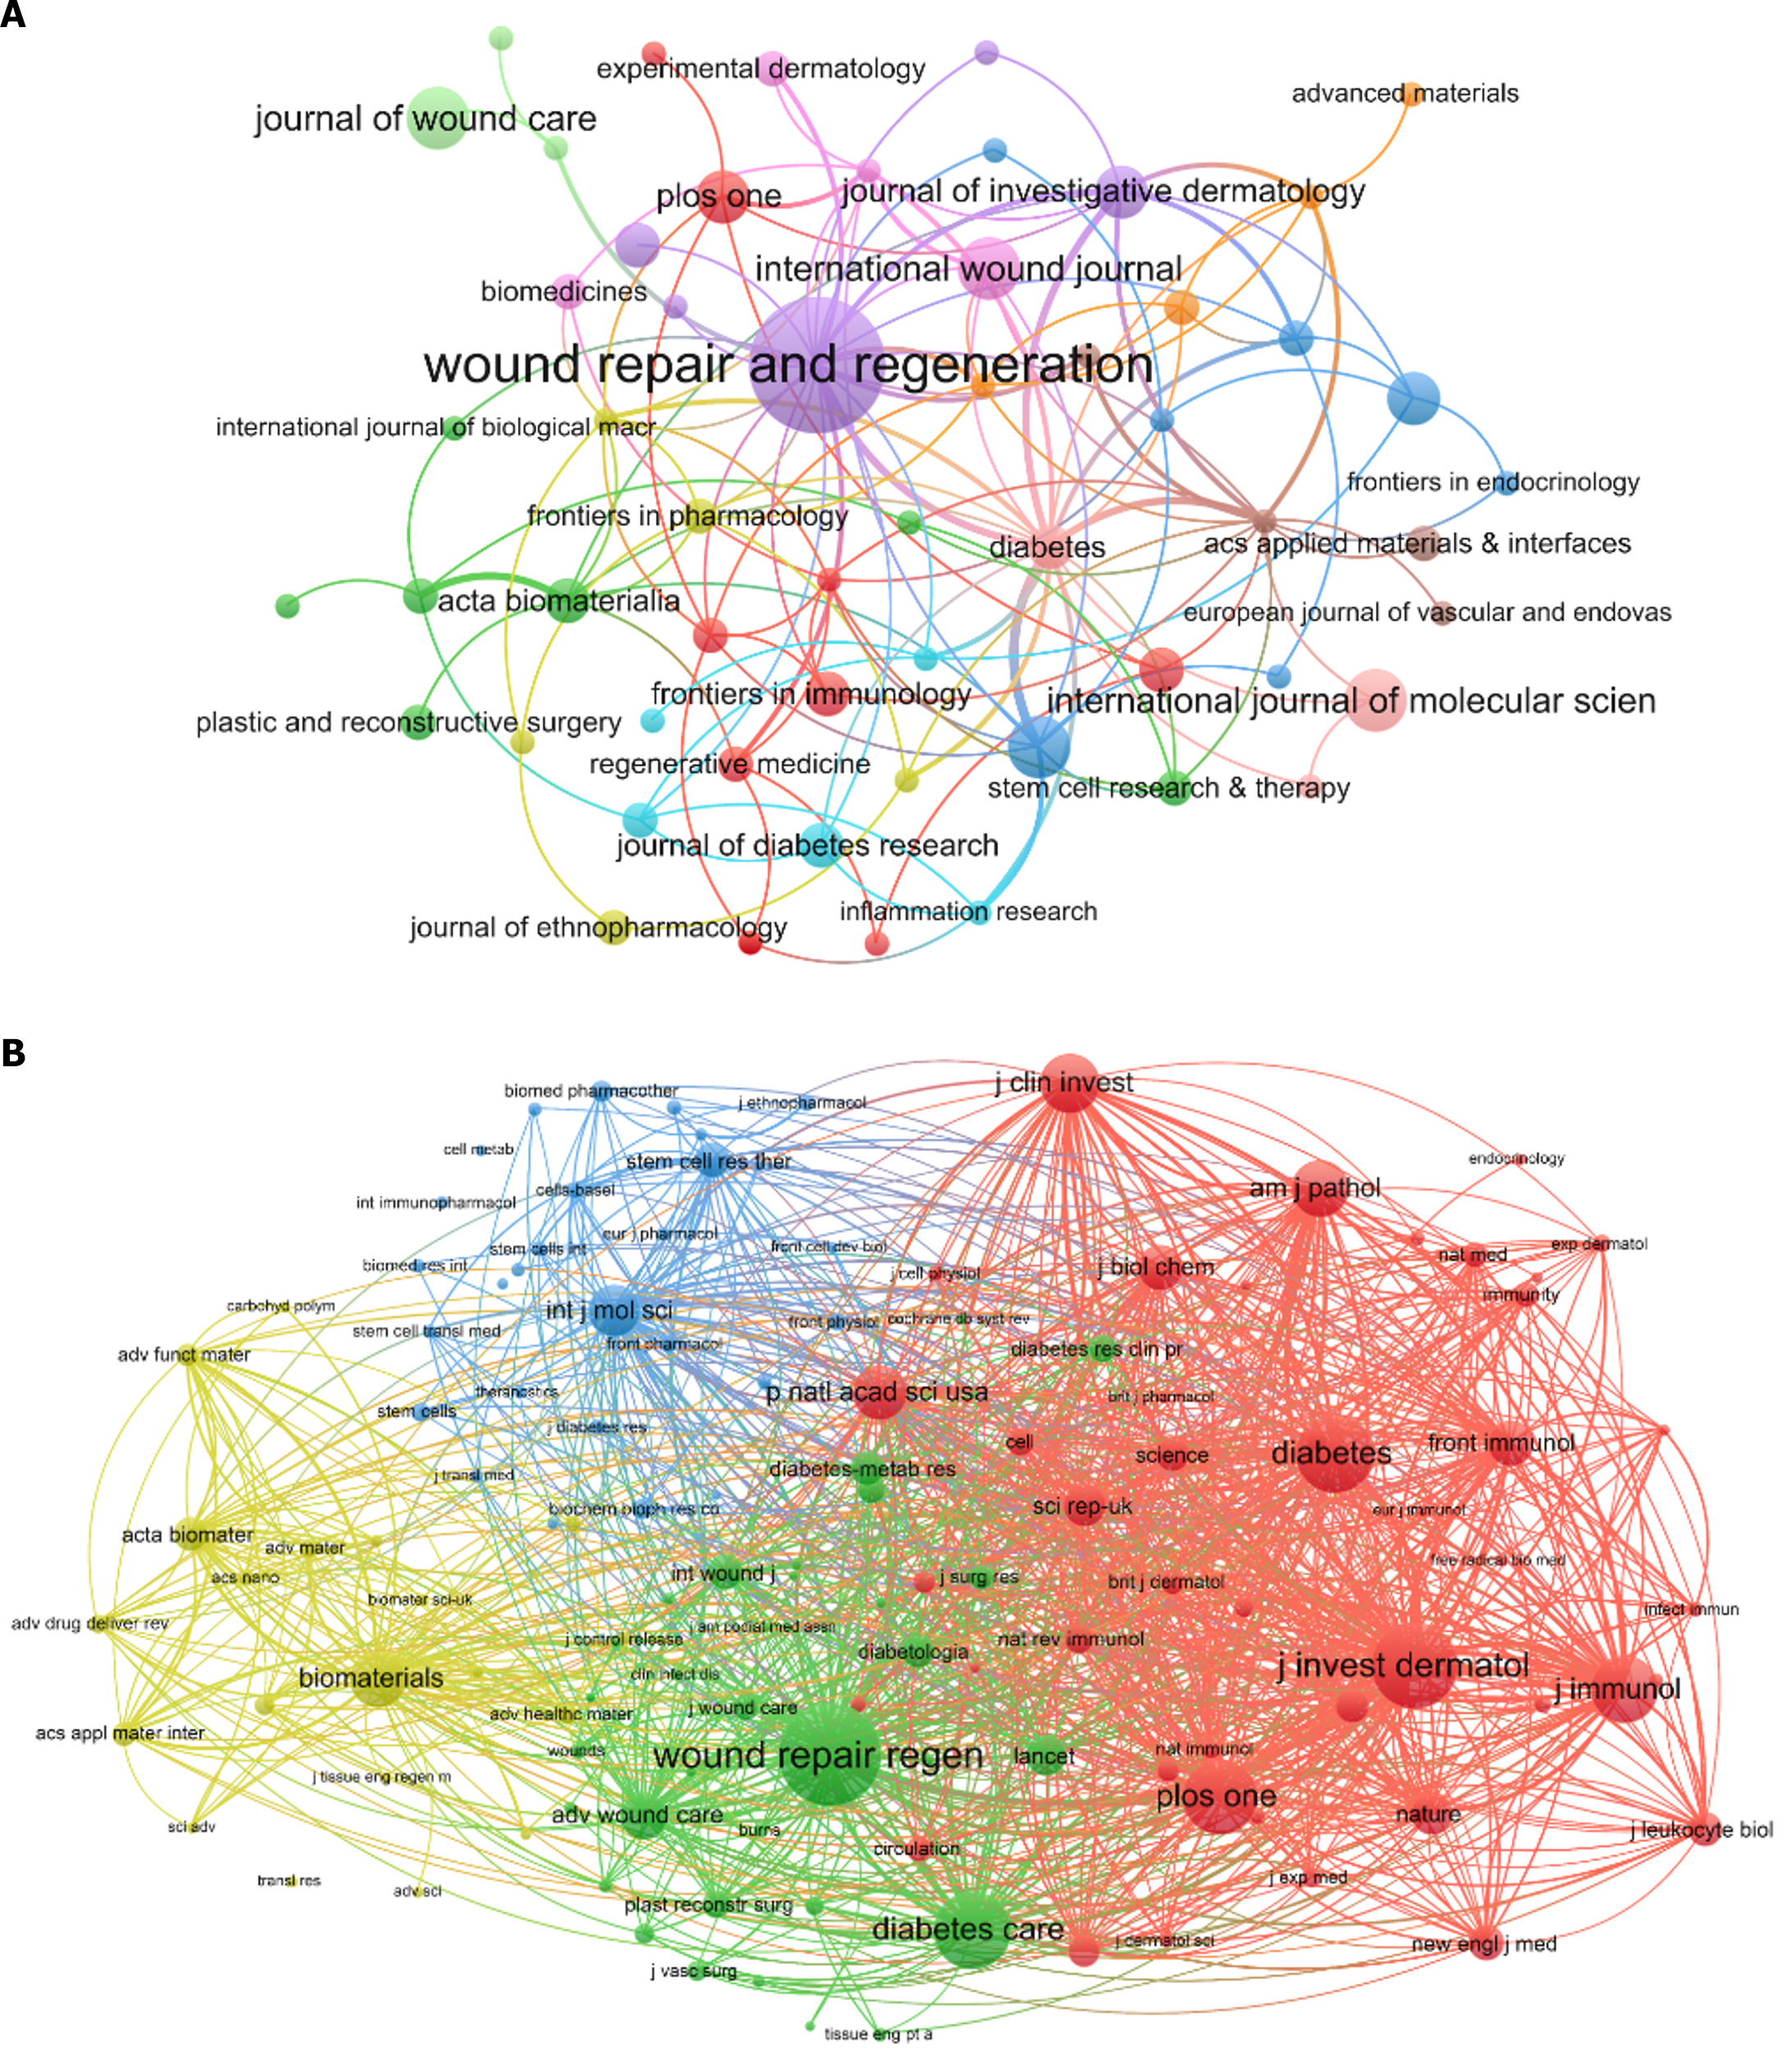
Figure 6 The network visualization map of journals and co-cited academic journals analysis.
Each journal is represented as a node. A: The node size is proportional to the number of publications (T = 2); B: The node size is proportional to the sum of co-citations (T = 30).
- Citation: Wen JP, Ou SJ, Liu JB, Zhang W, Qu YD, Li JX, Xia CL, Yang Y, Qi Y, Xu CP. Global trends in publications regarding macrophages-related diabetic foot ulcers in the last two decades. World J Diabetes 2024; 15(7): 1627-1644
- URL: https://www.wjgnet.com/1948-9358/full/v15/i7/1627.htm
- DOI: https://dx.doi.org/10.4239/wjd.v15.i7.1627


