Copyright
©The Author(s) 2024.
World J Diabetes. Jul 15, 2024; 15(7): 1627-1644
Published online Jul 15, 2024. doi: 10.4239/wjd.v15.i7.1627
Published online Jul 15, 2024. doi: 10.4239/wjd.v15.i7.1627
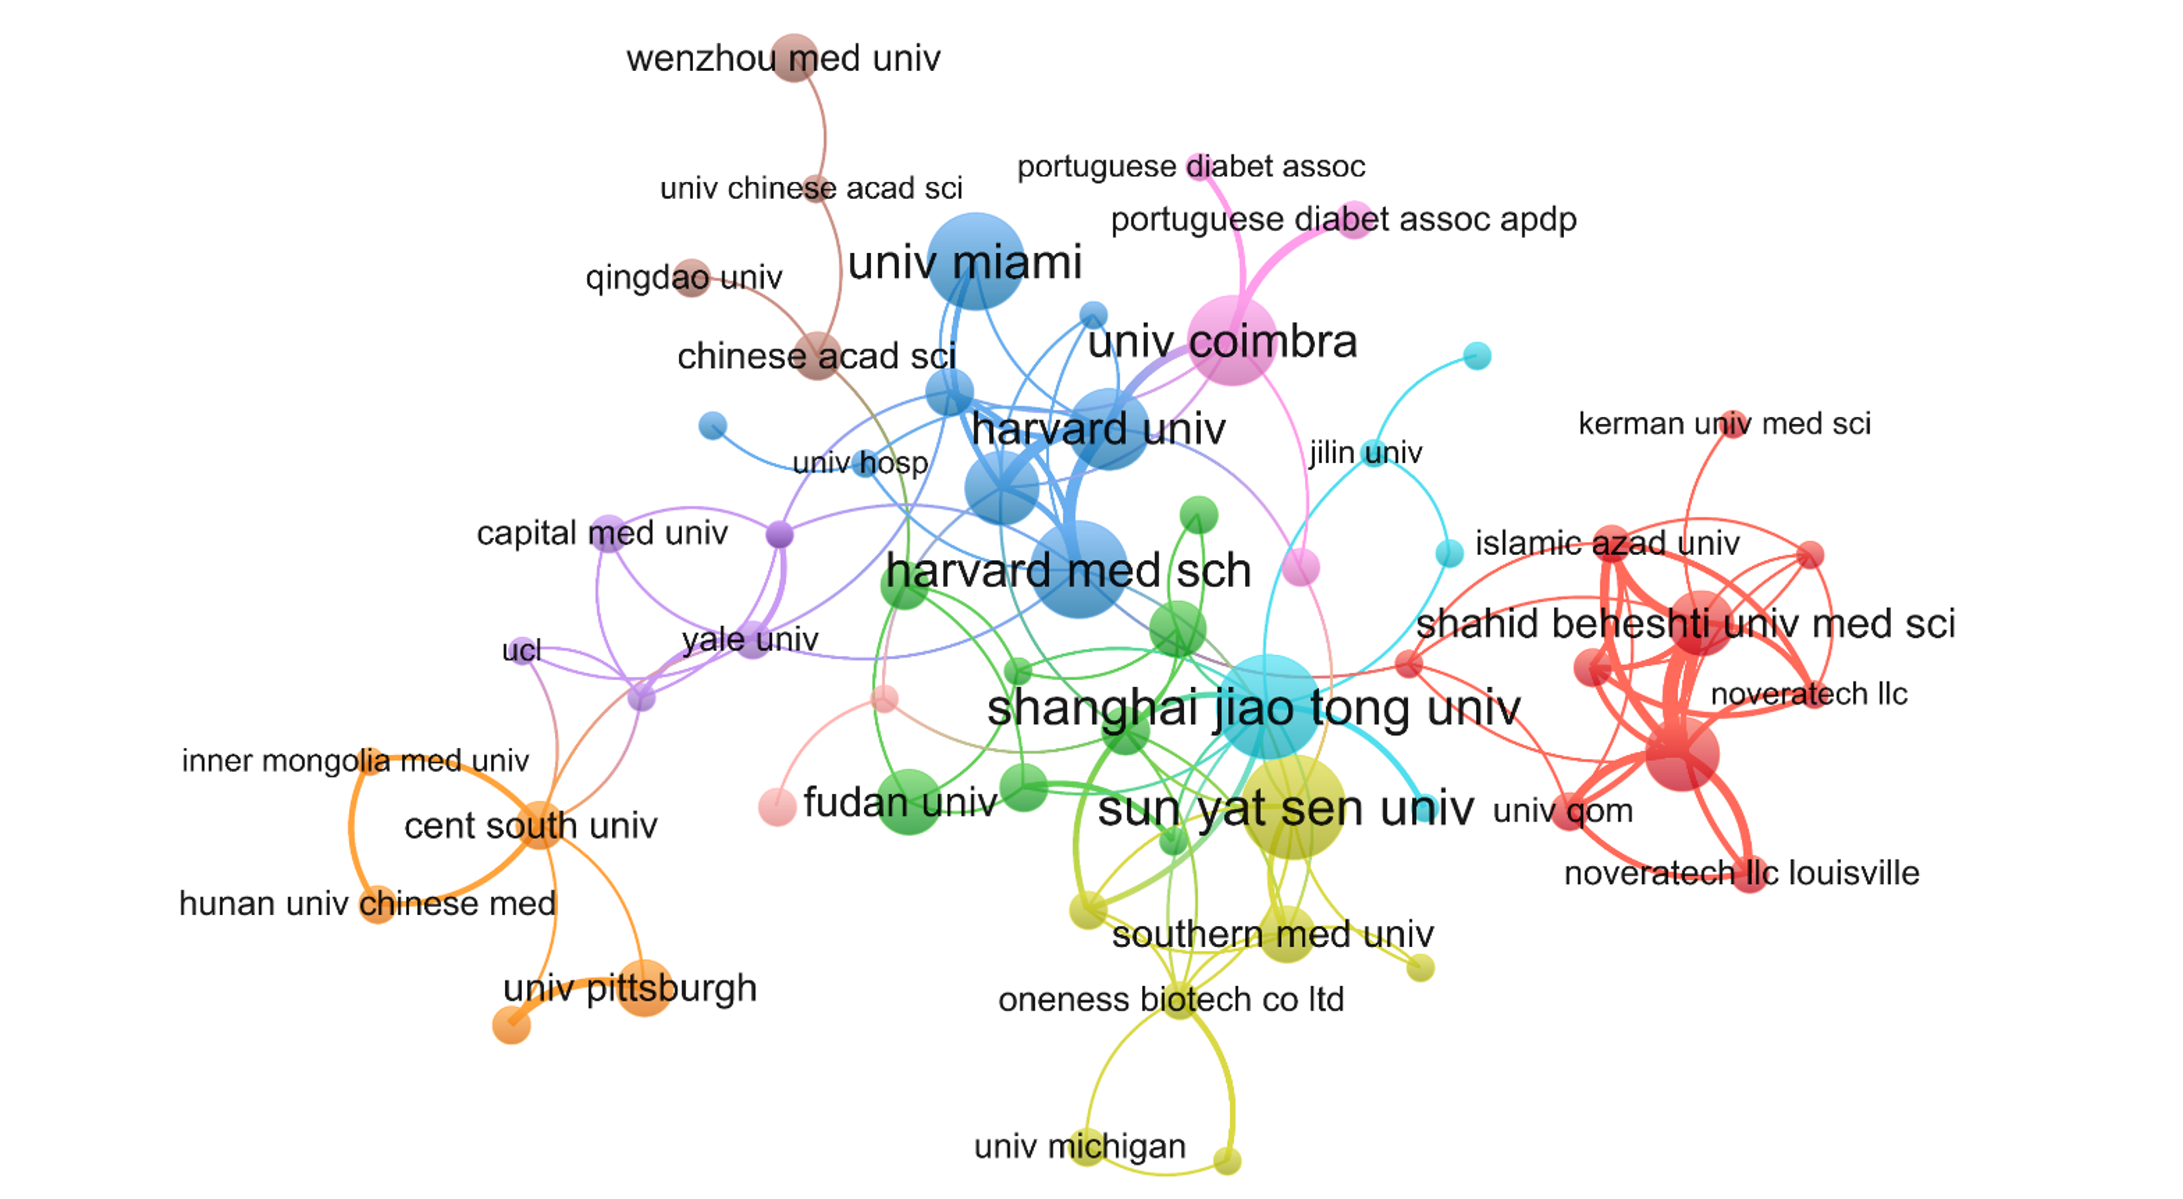
Figure 4 The institutions network diagram associated with this field.
A node represents an institution, and the size of each node represents its relative quantity of research output. Each line represents the strength of the cooperation relationship between two institutions, and strength value is displayed between lines. Threshold excludes institutions with ≥ 2 items published.
- Citation: Wen JP, Ou SJ, Liu JB, Zhang W, Qu YD, Li JX, Xia CL, Yang Y, Qi Y, Xu CP. Global trends in publications regarding macrophages-related diabetic foot ulcers in the last two decades. World J Diabetes 2024; 15(7): 1627-1644
- URL: https://www.wjgnet.com/1948-9358/full/v15/i7/1627.htm
- DOI: https://dx.doi.org/10.4239/wjd.v15.i7.1627


