Copyright
©The Author(s) 2024.
World J Diabetes. Jul 15, 2024; 15(7): 1589-1602
Published online Jul 15, 2024. doi: 10.4239/wjd.v15.i7.1589
Published online Jul 15, 2024. doi: 10.4239/wjd.v15.i7.1589
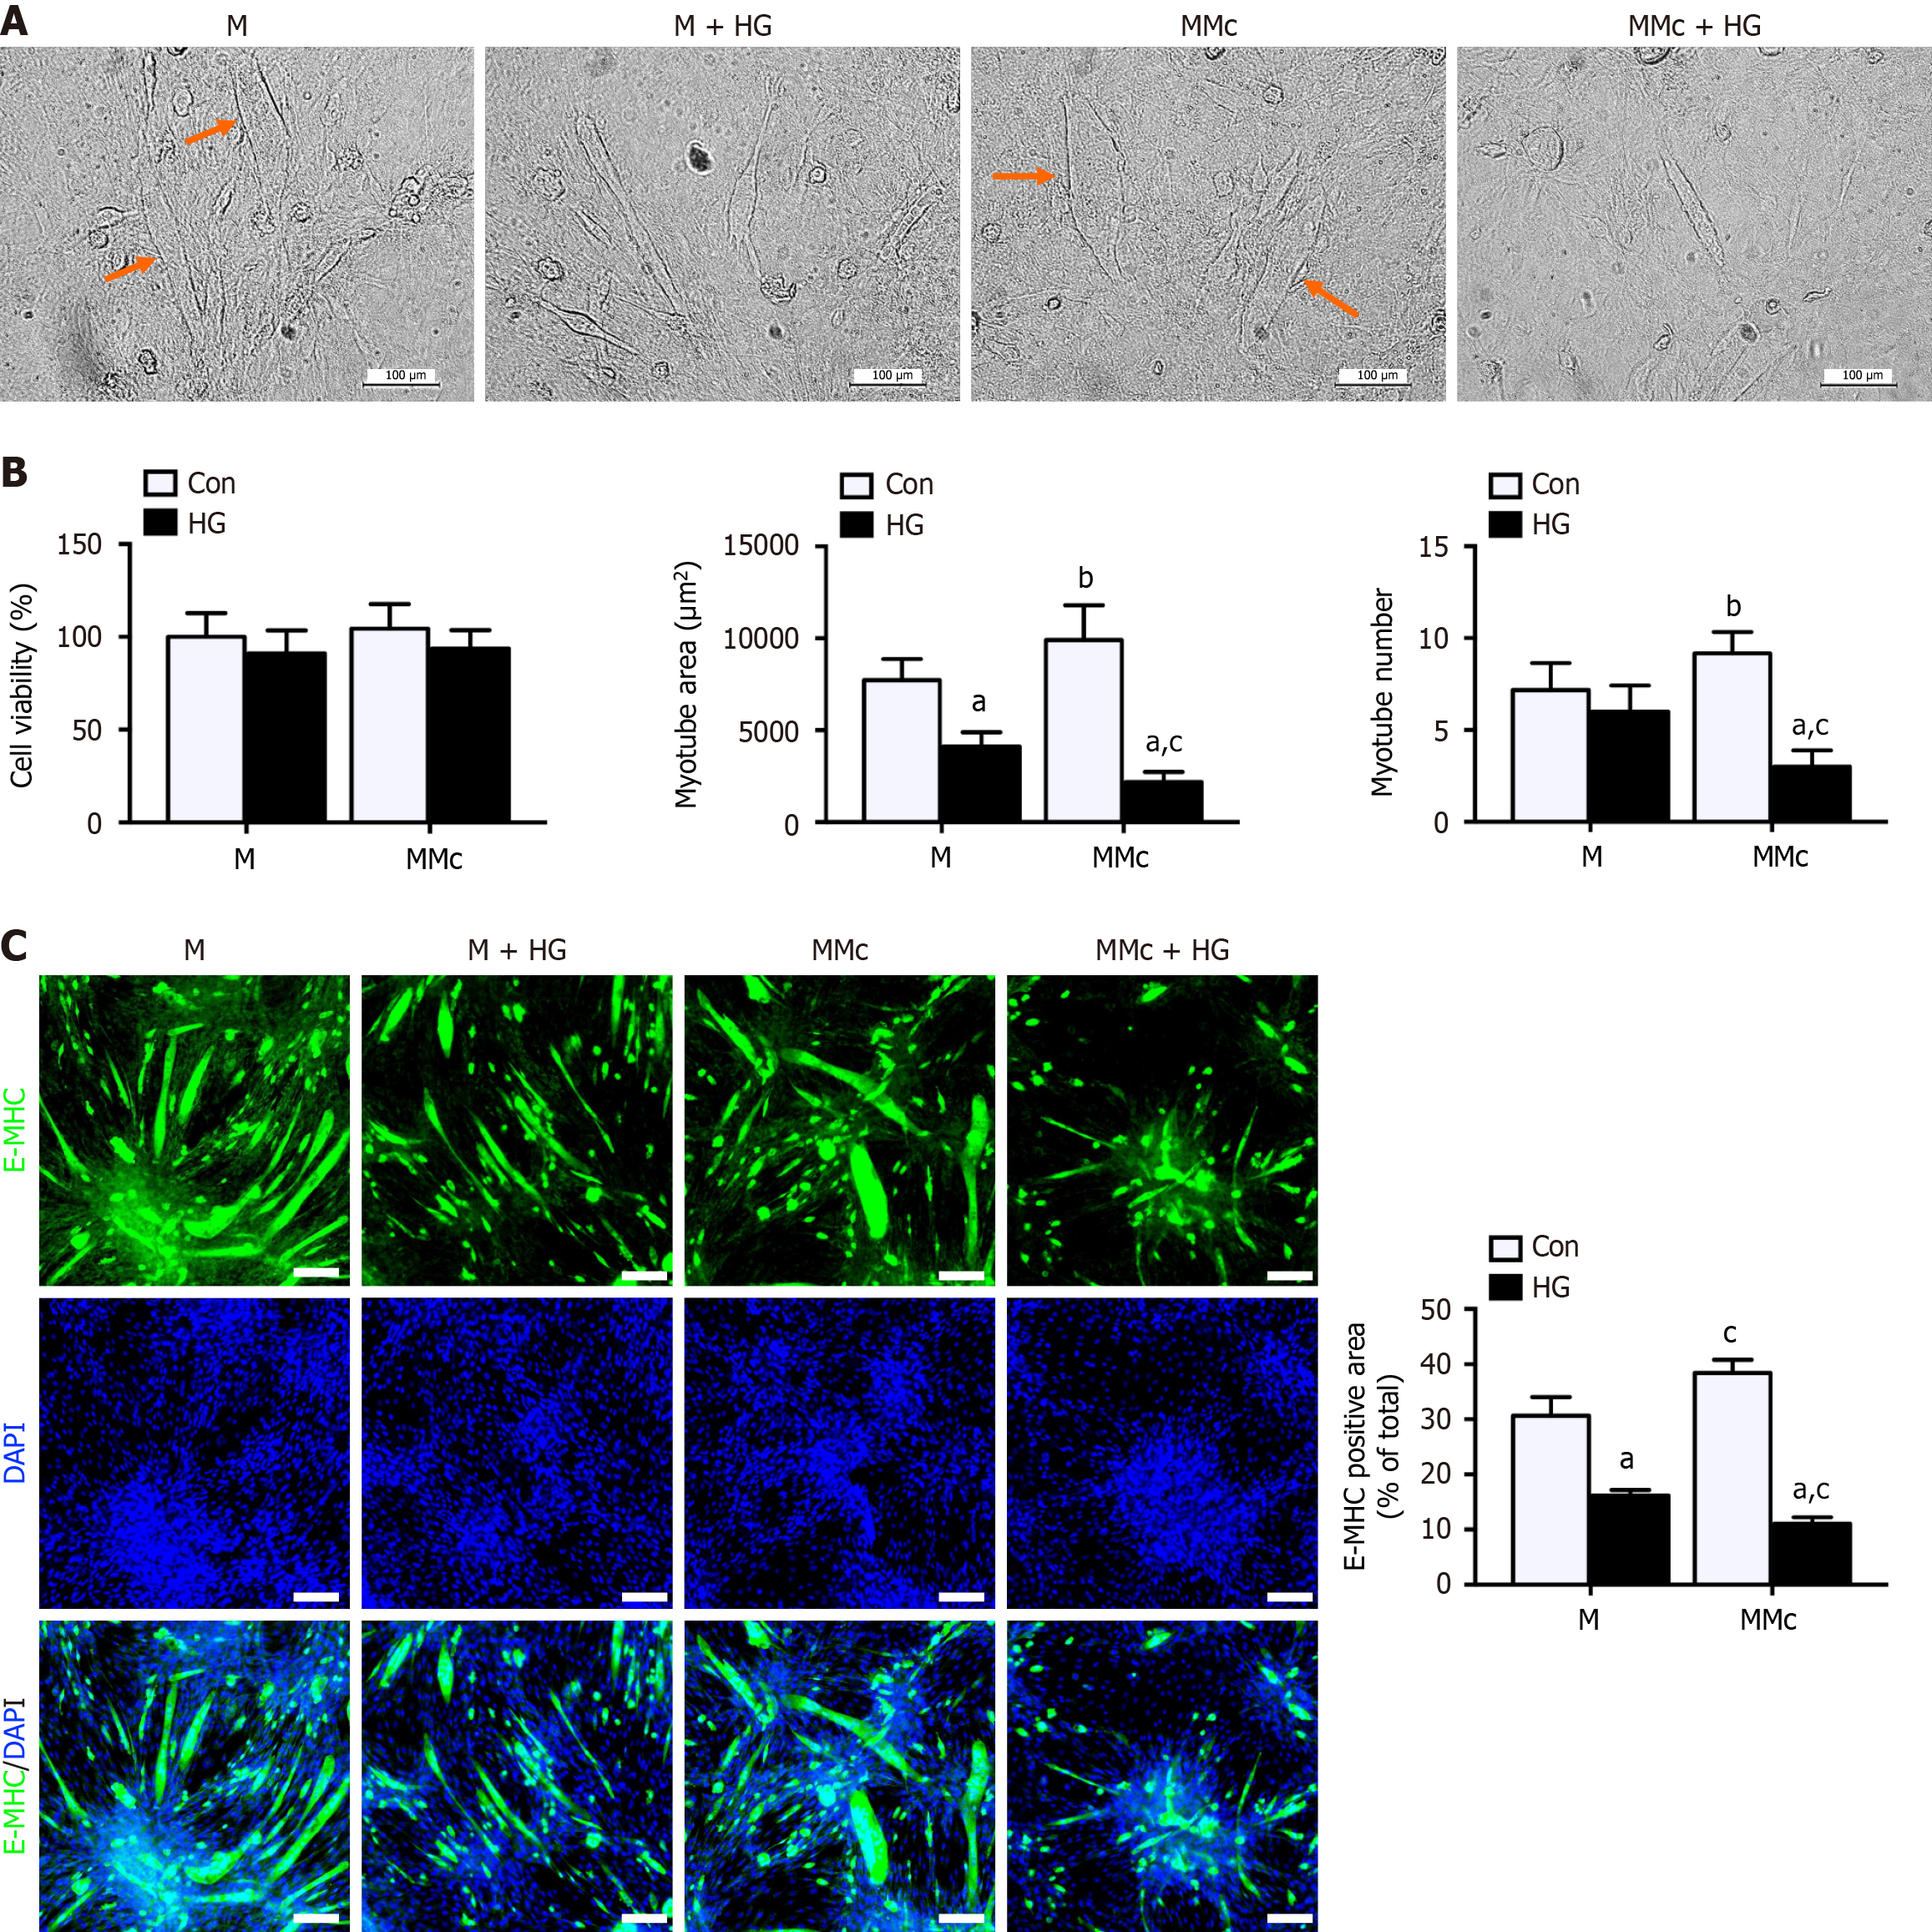
Figure 5 Inflammatory reaction induced by M1 macrophages inhibited myogenic differentiation and led to myotube atrophy.
A: Representative image of myotube by light microscopy, myotube were indicated with orange arrows (scale bar: 100 μm); B: The viability of myoblasts by CCK-8 assay; C: The ratios of E-MHC positive area in myotube by Immunofluorescence (scale bar: 50 μm). Data are means ± SD, n = 6 per group. aP < 0.01 main effect of high glucose; bP < 0.05, cP < 0.01 main effect of co-cultured with macrophages. P values were calculated by two-way analysis of variances. M: Myoblasts; M + HG: Myoblasts cultured in high glucose medium; MMc: Myoblasts co-cultured with macrophages; MMc + HG: Myoblasts co-cultured with macrophages in high glucose medium; HG: High glucose.
- Citation: Luo W, Zhou Y, Wang LY, Ai L. Interactions between myoblasts and macrophages under high glucose milieus result in inflammatory response and impaired insulin sensitivity. World J Diabetes 2024; 15(7): 1589-1602
- URL: https://www.wjgnet.com/1948-9358/full/v15/i7/1589.htm
- DOI: https://dx.doi.org/10.4239/wjd.v15.i7.1589


