Copyright
©The Author(s) 2024.
World J Diabetes. Jul 15, 2024; 15(7): 1589-1602
Published online Jul 15, 2024. doi: 10.4239/wjd.v15.i7.1589
Published online Jul 15, 2024. doi: 10.4239/wjd.v15.i7.1589
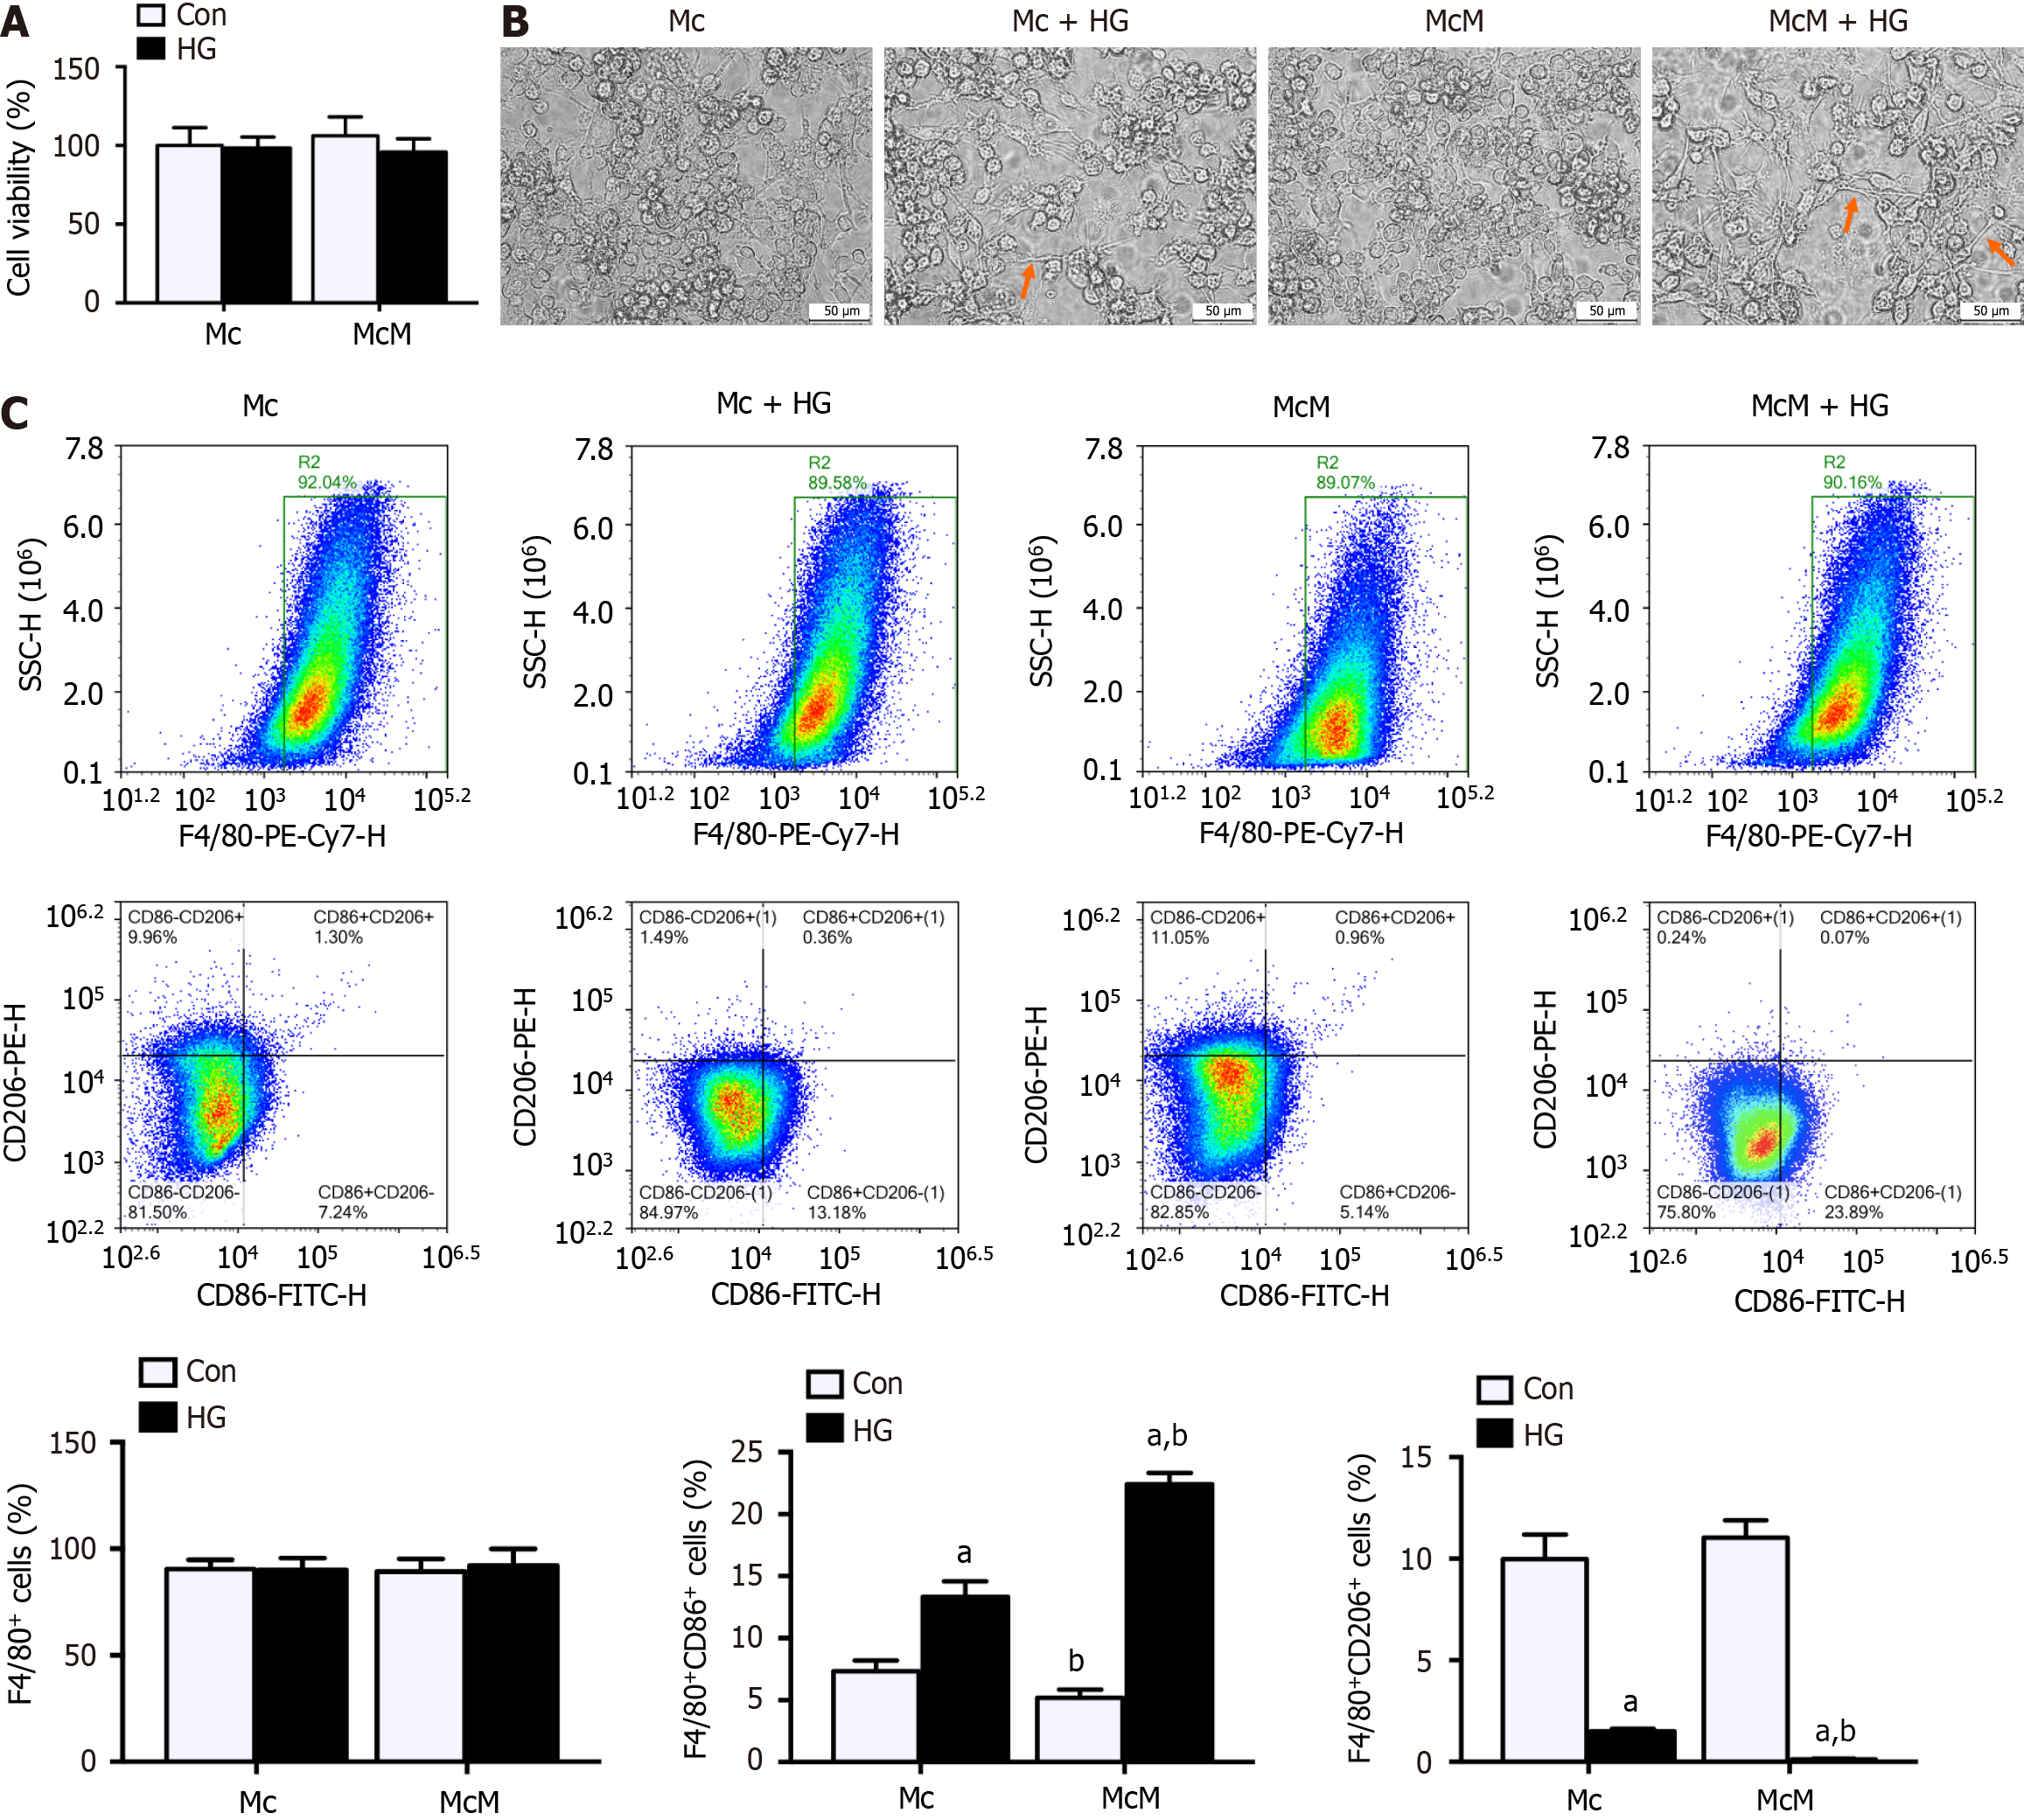
Figure 3 Myoblast under high glucose milieus resulted in macrophages polarizing to pro-inflammatory M1 phenotype.
A: The viability of macrophages by CCK-8 assay; B: Representative image of macrophages by Light Microscopy, inflammatory phenotype in morphology were indicated with orange arrows (Scale bar: 50 μm); C: The ratios of F4/80+ cells, F4/80+CD86+ cells, and F4/80+CD206+ cells in macrophages by Flow Cytometry. Data are means ± SD, n = 6 per group. aP < 0.01 main effect of high glucose; bP < 0.01 main effect of co-cultured with myoblasts. P values were calculated by two-way analysis of variances. Mc: Macrophages; Mc + HG: Macrophages cultured in high glucose medium; McM: Macrophages co-cultured with myoblasts; McM + HG: Macrophages co-cultured with myoblasts in high glucose medium; HG: High glucose.
- Citation: Luo W, Zhou Y, Wang LY, Ai L. Interactions between myoblasts and macrophages under high glucose milieus result in inflammatory response and impaired insulin sensitivity. World J Diabetes 2024; 15(7): 1589-1602
- URL: https://www.wjgnet.com/1948-9358/full/v15/i7/1589.htm
- DOI: https://dx.doi.org/10.4239/wjd.v15.i7.1589


