Copyright
©The Author(s) 2024.
World J Diabetes. Jul 15, 2024; 15(7): 1562-1588
Published online Jul 15, 2024. doi: 10.4239/wjd.v15.i7.1562
Published online Jul 15, 2024. doi: 10.4239/wjd.v15.i7.1562
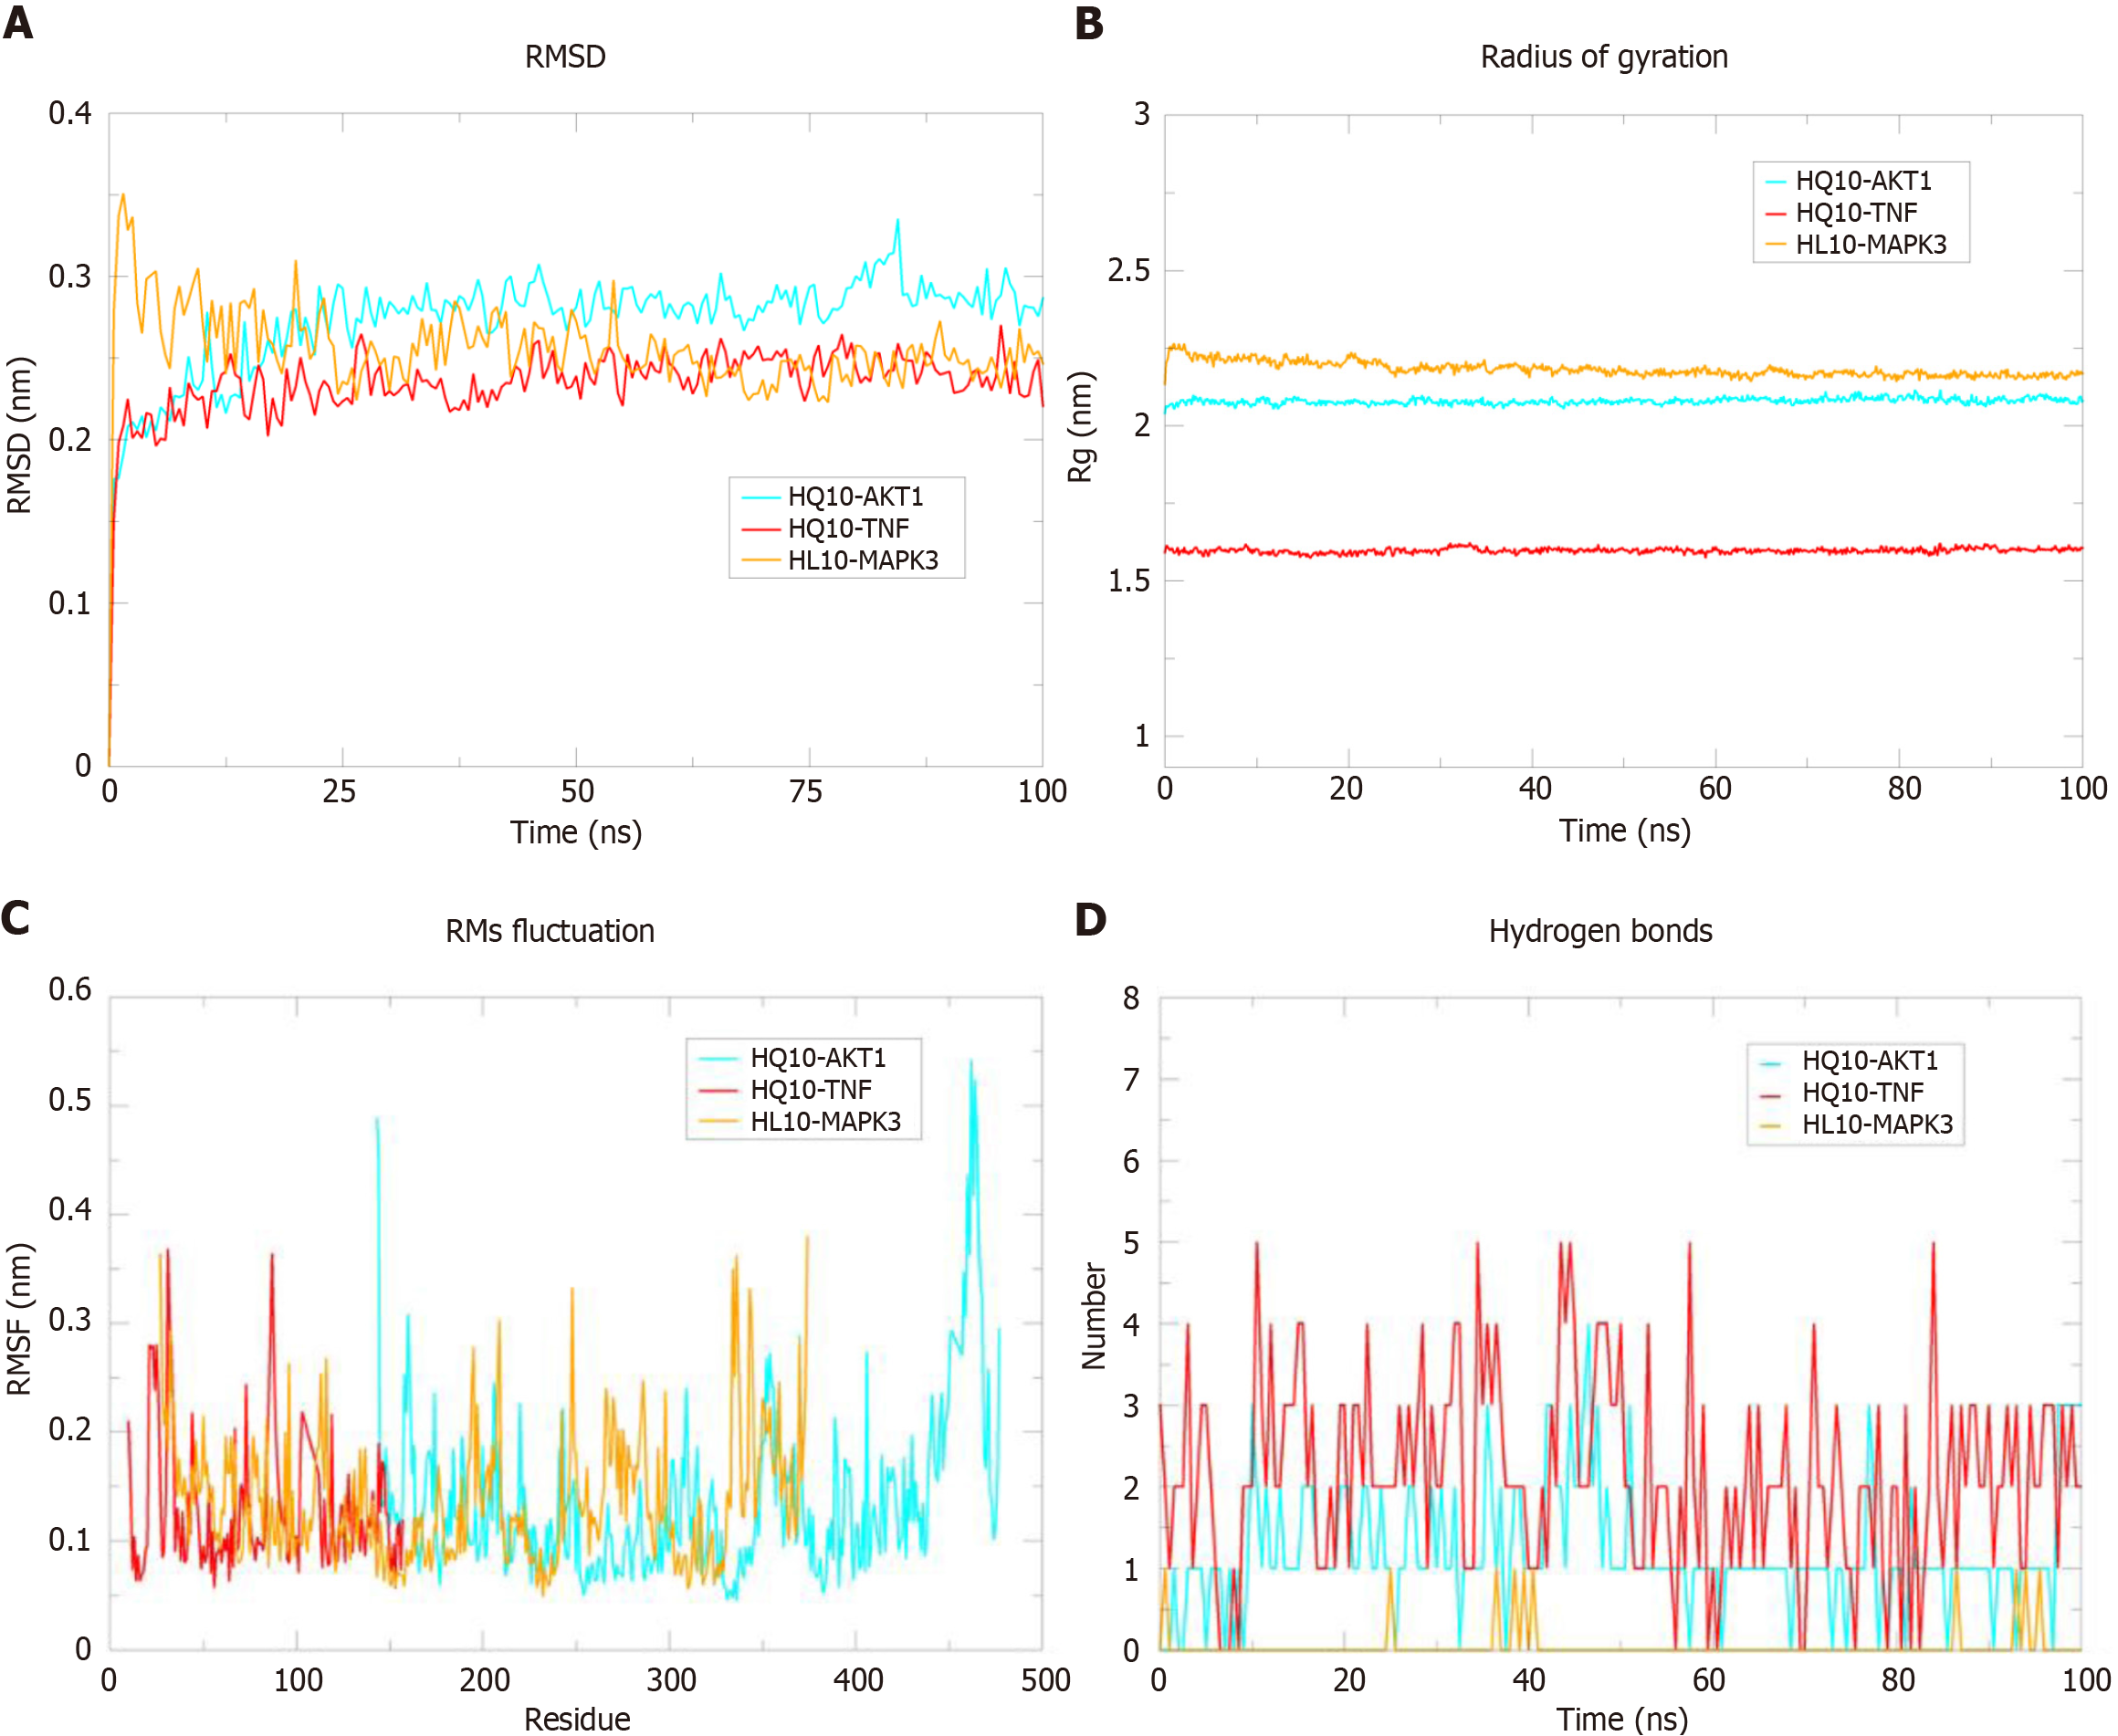
Figure 10 Molecular dynamics simulations of HL10 (obacunone)-mitogen-activated protein kinase 3, HQ10 (quercetin)-AKT serine/threonine kinase 1, and HQ10 (quercetin)-tumor necrosis factor.
A: Root mean square deviation (RMSD) plots of HL10-mitogen-activated protein kinase 3 (MAPK3), HQ10-quercetin-AKT serine/threonine kinase 1 (AKT1), and HQ10-tumor necrosis factor (TNF) protein complexes; B: Rg plot of HL10-MAPK3, HQ10-AKT1, and HQ10-TNF protein complexes; C: Root mean square fluctuation (RMSF) plots of HL10-MAPK3, HQ10-AKT1, and HQ10-TNF protein complexes; D: Number of hydrogen bonds in HL10-MAPK3, HQ10-AKT1, and HQ10-TNF protein complexes.
- Citation: Zhang MY, Zheng SQ. Network pharmacology and molecular dynamics study of the effect of the Astragalus-Coptis drug pair on diabetic kidney disease. World J Diabetes 2024; 15(7): 1562-1588
- URL: https://www.wjgnet.com/1948-9358/full/v15/i7/1562.htm
- DOI: https://dx.doi.org/10.4239/wjd.v15.i7.1562


