Copyright
©The Author(s) 2024.
World J Diabetes. Jul 15, 2024; 15(7): 1562-1588
Published online Jul 15, 2024. doi: 10.4239/wjd.v15.i7.1562
Published online Jul 15, 2024. doi: 10.4239/wjd.v15.i7.1562
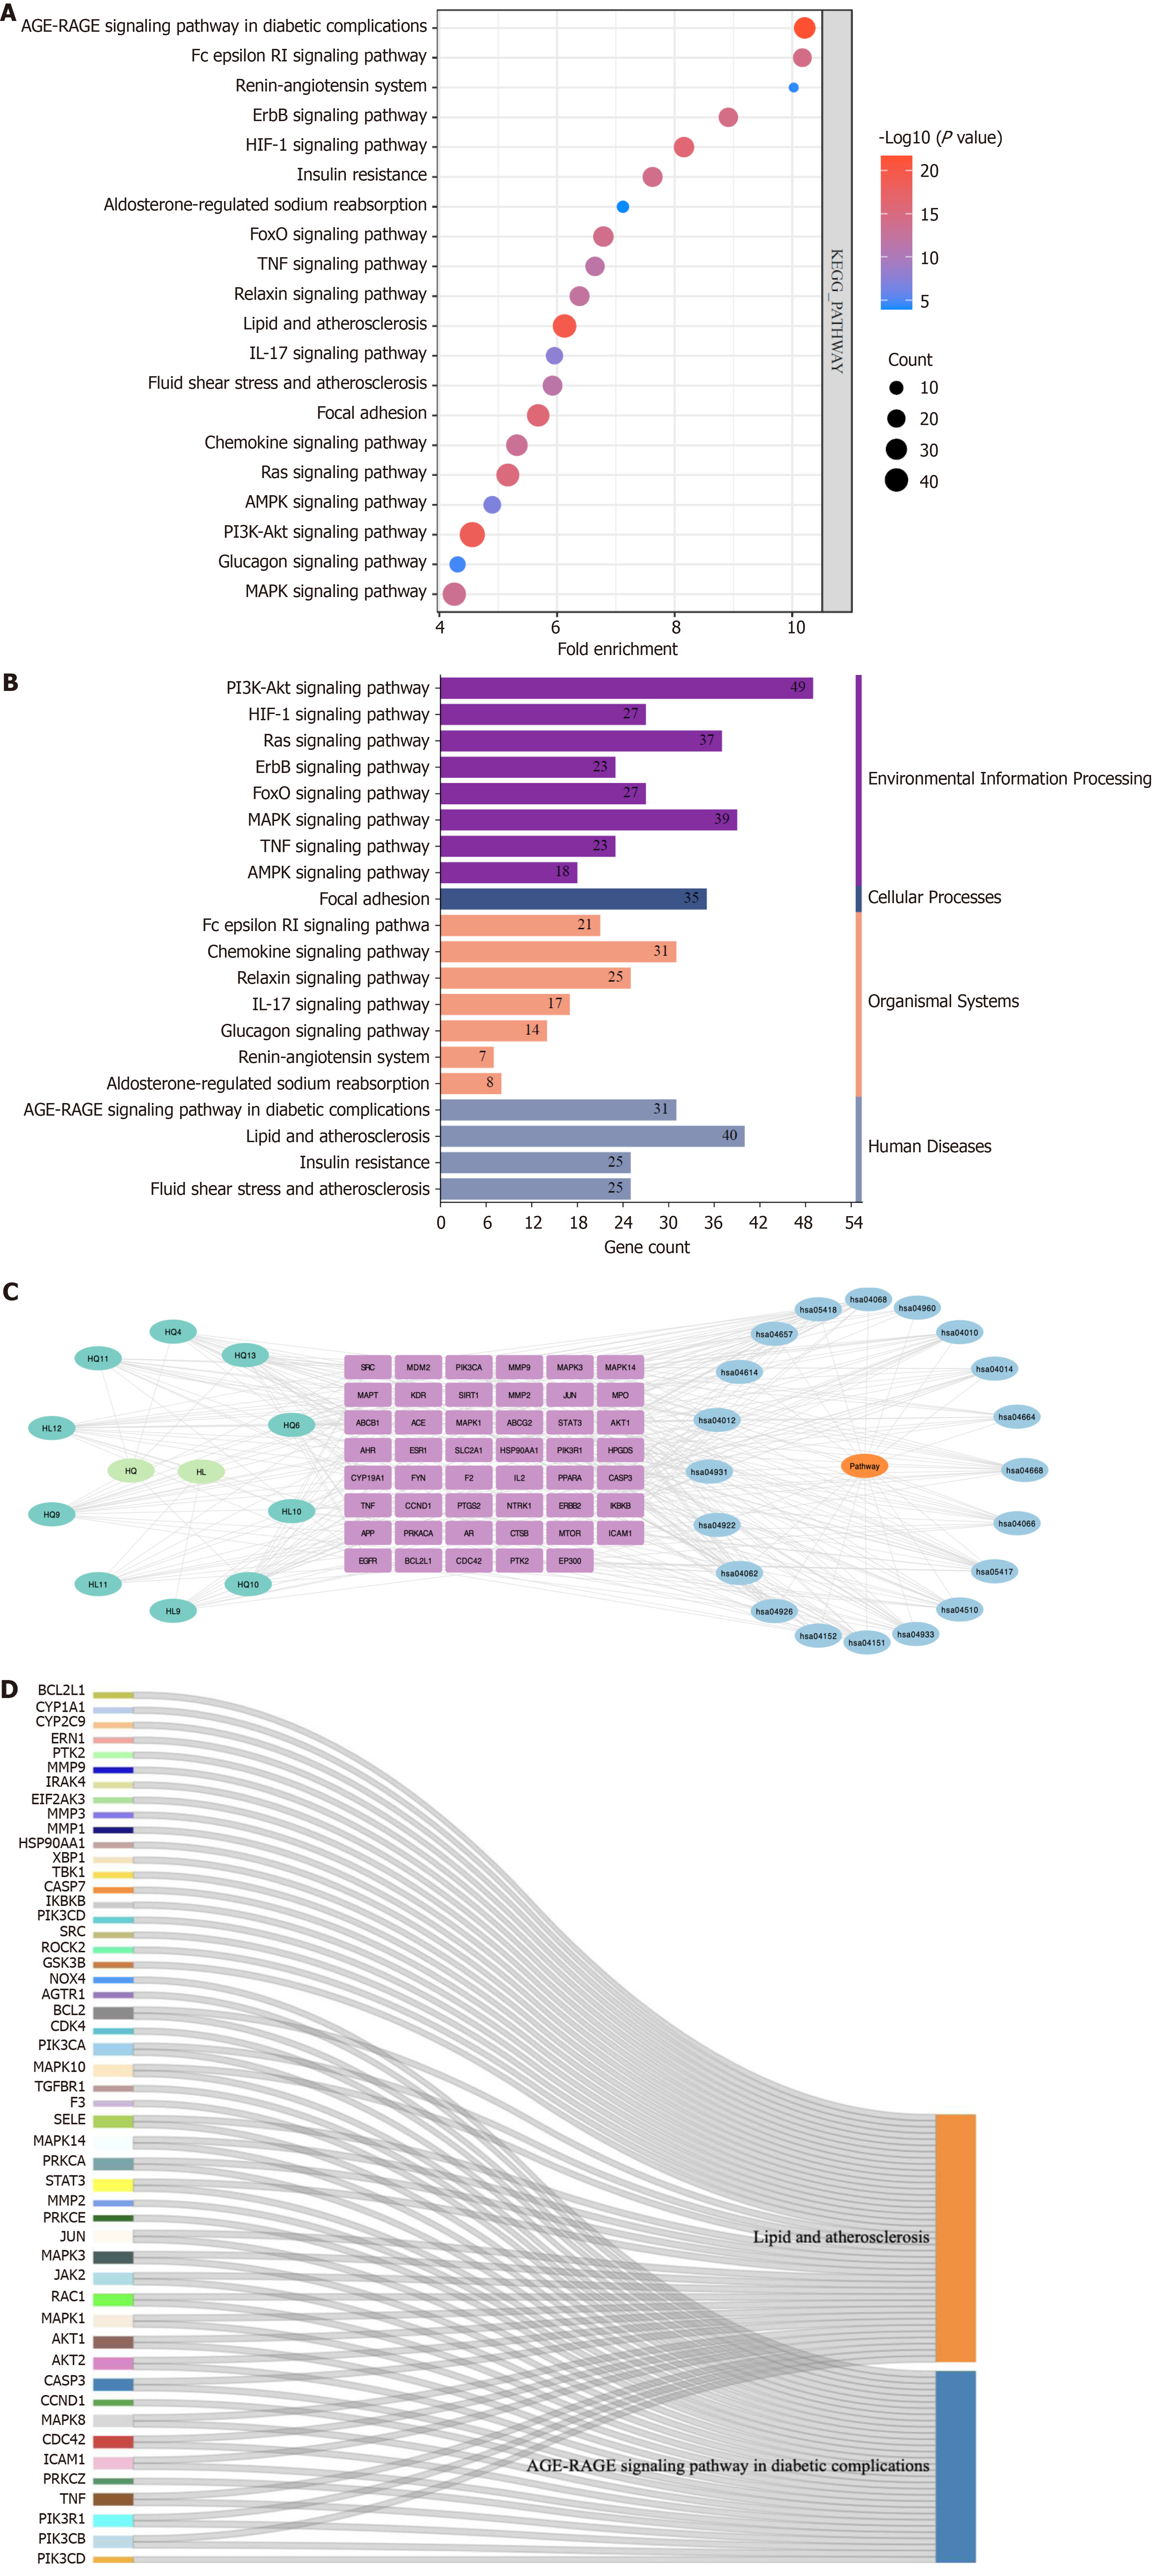
Figure 5 Kyoto Encyclopedia of Genes and Genomes pathway enrichment diagram.
A: Bubble plot depicting the top 20 pathways identified through Kyoto Encyclopedia of Genes and Genomes (KEGG) enrichment analysis; B: Classification of the top 20 pathways based on KEGG enrichment analysis according to their respective KEGG types; C: Diagram illustrating the active ingredient-target-signaling pathway. The cyan node represents the active ingredient, while the purple node signifies the target. The blue node denotes the pathway itself; D: Sankey diagram showcasing KEGG core pathways. The left rectangular node in this sankey plot represents the target, whereas the right rectangular node symbolizes the corresponding KEGG pathway. The lines represent associations between targets and pathways.
- Citation: Zhang MY, Zheng SQ. Network pharmacology and molecular dynamics study of the effect of the Astragalus-Coptis drug pair on diabetic kidney disease. World J Diabetes 2024; 15(7): 1562-1588
- URL: https://www.wjgnet.com/1948-9358/full/v15/i7/1562.htm
- DOI: https://dx.doi.org/10.4239/wjd.v15.i7.1562


