Copyright
©The Author(s) 2024.
World J Diabetes. Jul 15, 2024; 15(7): 1562-1588
Published online Jul 15, 2024. doi: 10.4239/wjd.v15.i7.1562
Published online Jul 15, 2024. doi: 10.4239/wjd.v15.i7.1562
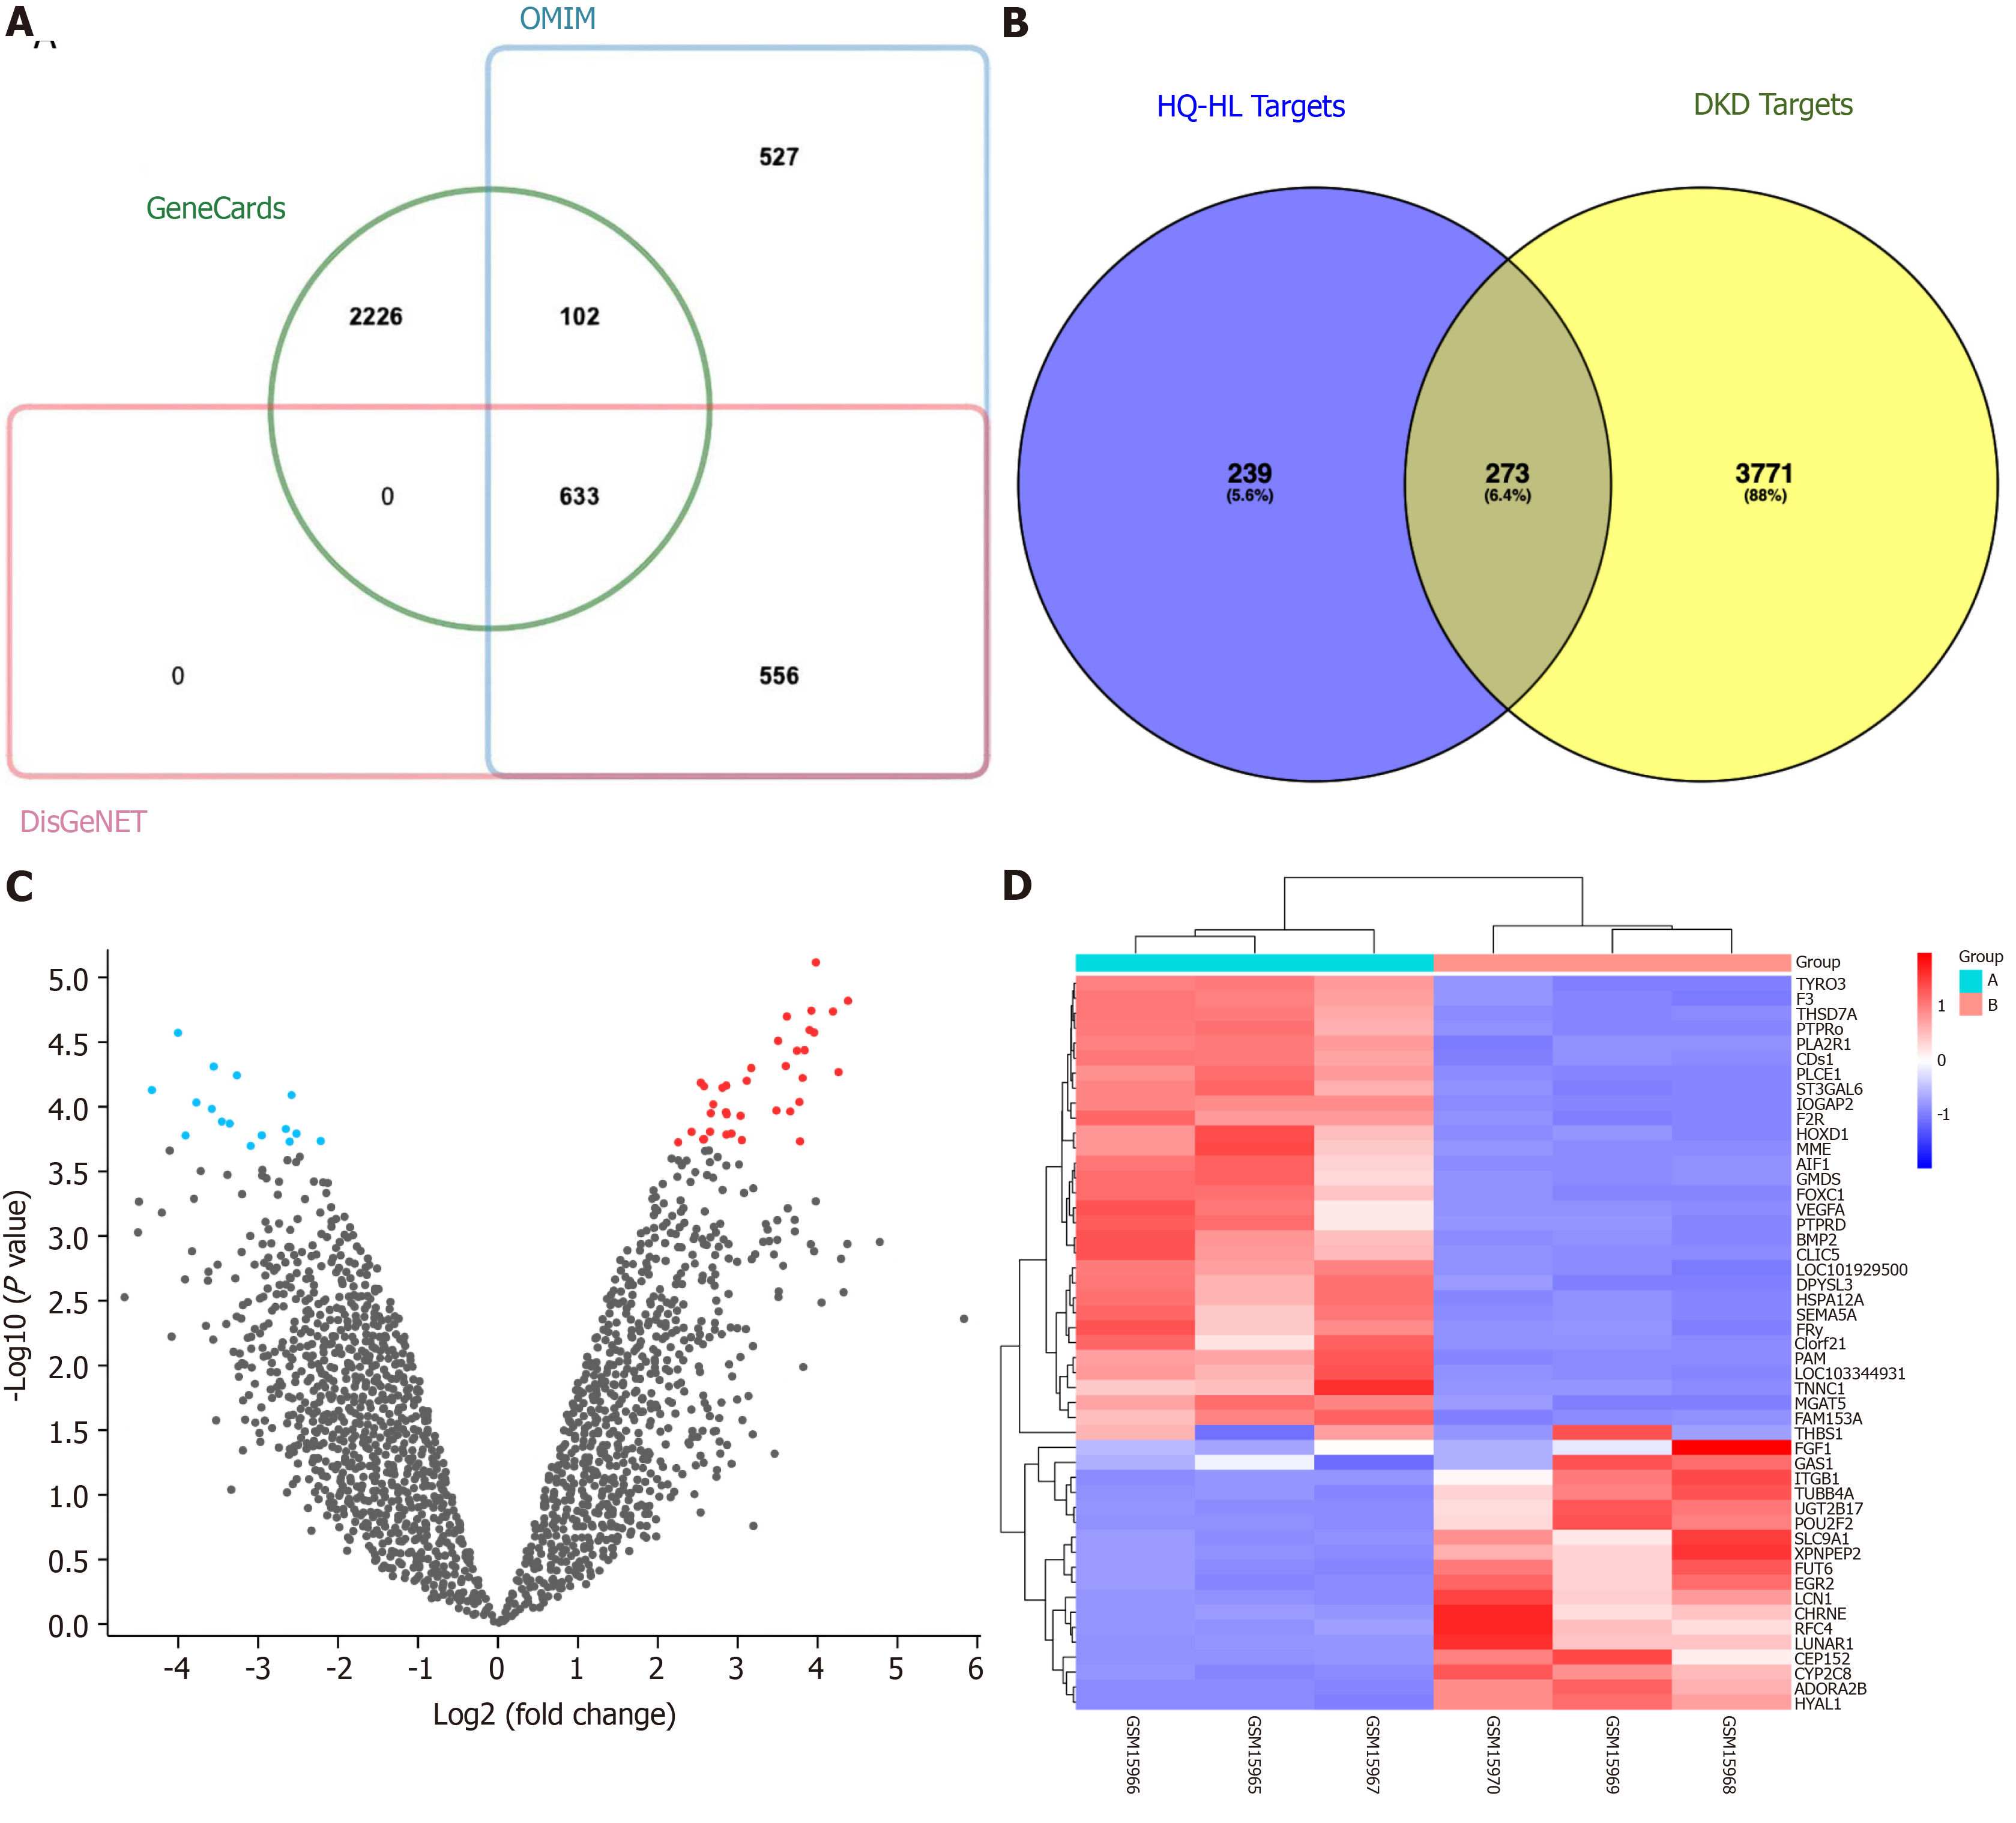
Figure 1 Screening of Astragalus-Coptis drug pair common targets.
A: Venn diagram illustrating the target genes associated with diabetic kidney disease (DKD); B: Venn diagram depicting the 273 common targets between the active ingredient targets and DKD targets; C: Volcano plot displaying differential gene expression patterns in DKD samples, where red and blue indicate upregulated and downregulated genes, respectively, while gray represents no significant difference; D: Heatmap presenting the expression profiles of these 50 differential gene expression analysis. Columns correspond to sample groups, while rows represent individual genes. The cyan Group A denotes normal samples, whereas the red Group B signifies DKD samples. OMIM: Online Mendelian Inheritance in Man database.
- Citation: Zhang MY, Zheng SQ. Network pharmacology and molecular dynamics study of the effect of the Astragalus-Coptis drug pair on diabetic kidney disease. World J Diabetes 2024; 15(7): 1562-1588
- URL: https://www.wjgnet.com/1948-9358/full/v15/i7/1562.htm
- DOI: https://dx.doi.org/10.4239/wjd.v15.i7.1562


