Copyright
©The Author(s) 2024.
World J Diabetes. Jul 15, 2024; 15(7): 1537-1550
Published online Jul 15, 2024. doi: 10.4239/wjd.v15.i7.1537
Published online Jul 15, 2024. doi: 10.4239/wjd.v15.i7.1537
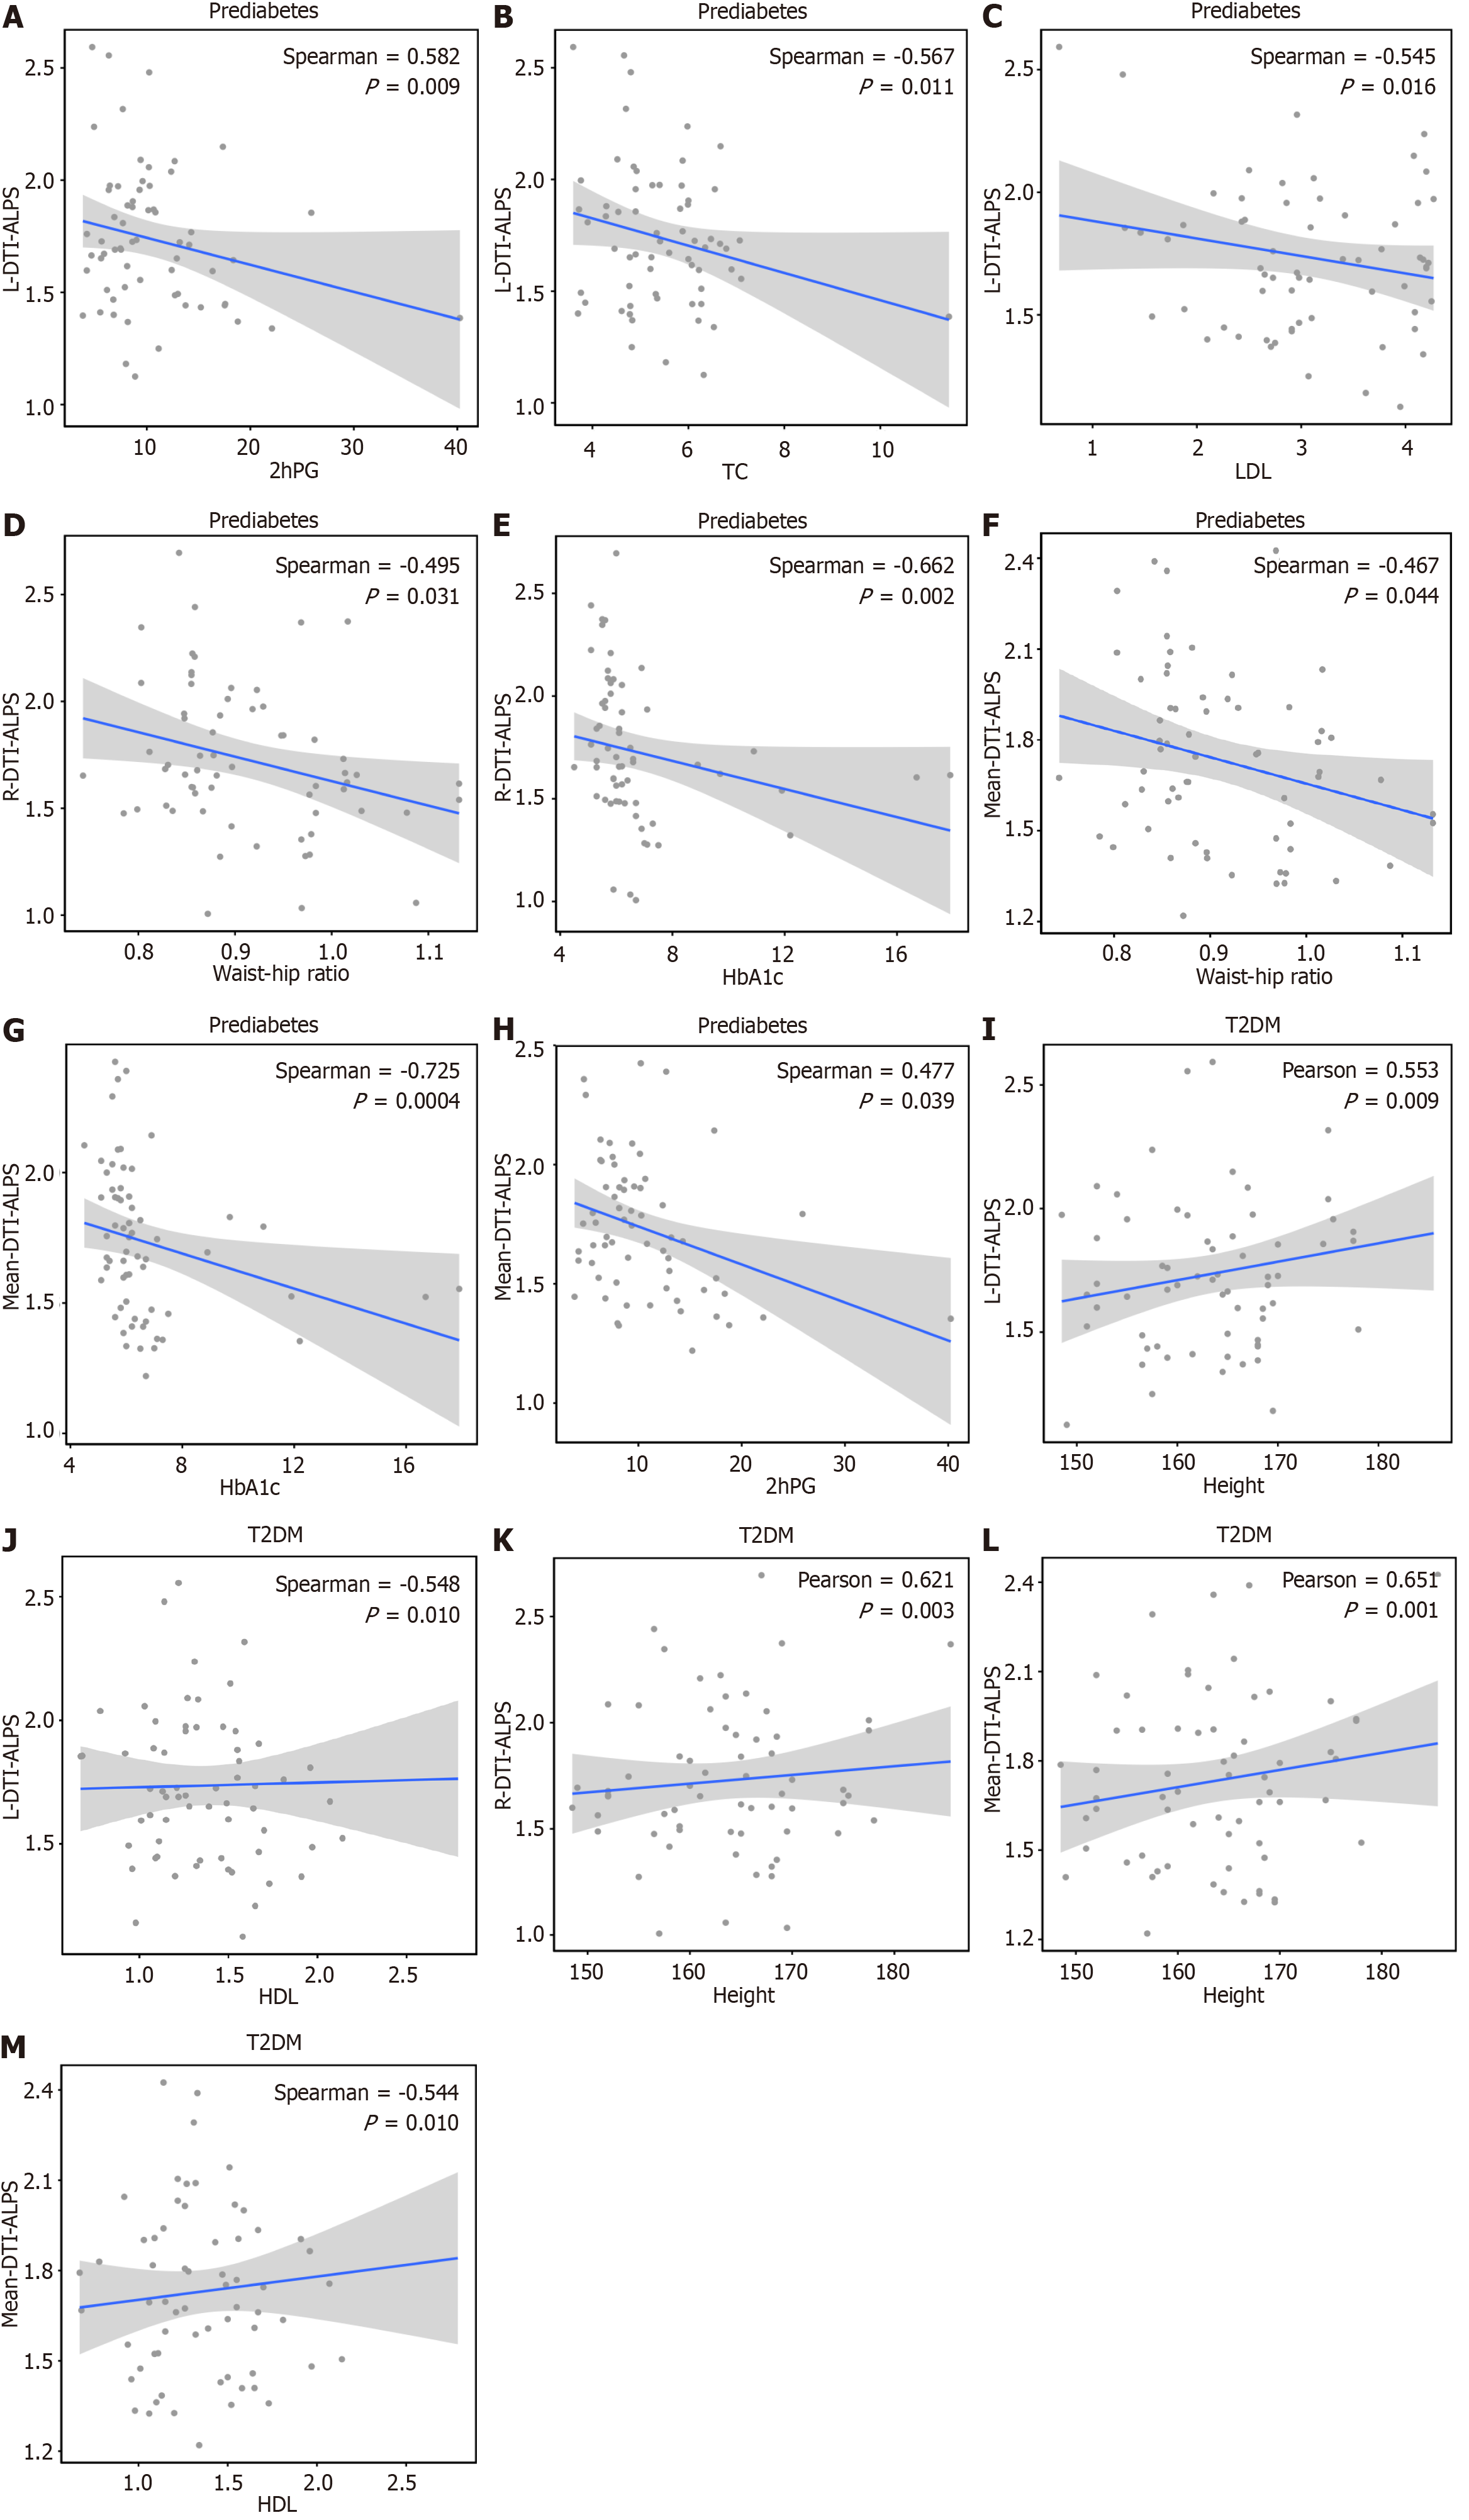
Figure 4 The correlation between the diffusion tensor image analysis method along the perivascular space index and other clinical features.
A: The left-side diffusion tensor image analysis method along the perivascular space (DTI-ALPS) index in the prediabetes group was positively correlated with 2-hour postprandial glucose (2hPG) (r = 0. 582, P = 0.009, 95%CI: 0.192 to 0.830); B and C:The left-side DTI-ALPS index in the prediabetes group was negatively correlated with total cholesterol (r = -0.567, P = 0.011, 95%CI: -0.831 to -0.152) and low-density lipoprotein (r = -0.545, P = 0.016, 95%CI: -0.720 to 0.235); D and E: The right-side DTI-ALPS index in the prediabetes group was negatively correlated with waist-to-hip ratio (r = -0. 495, P = 0.031, 95%CI: -0.784 to 0.017) and glycosylated hemoglobin (HbA1c) (r = -0.662, P = 0.002, 95%CI: -0.867 to -0.122); F and G: The mean DTI-ALPS index in the prediabetes group negatively correlated with waist-to-hip ratio (r = -0.467, P = 0.044, 95%CI: -0.770 to 0.067) and HbA1c (r = -0.725, P = 0.0004, 95%CI: -0.886 to -0.398); H:The mean DTI-ALPS index in the prediabetes group was positively correlated with 2hPG (r = 0.477, P = 0.039, 95%CI: -0.103 to 0.797); I: The left-side DTI-ALPS index in the type 2 diabetes mellitus (T2DM) group was positively correlated with height (r = 0.553, P = 0.009, 95%CI: -0.142 to 0.822); J: The left-side DTI-ALPS index in the T2DM group was negatively correlated with high-density lipoprotein (HDL) (r = -0.548, P = 0.010, 95%CI: -0.792 to -0.109); K: The right-side DTI-ALPS index in the T2DM group was positively correlated with height (r = 0.621, P = 0.003, 95%CI: 0.096 to 0.828); L: The mean DTI-ALPS index of the T2DM group was positively correlated with height (r = 0.651, P = 0.001, 95%CI: 0.016 to 0.853); M: The mean DTI-ALPS index in the T2DM group negatively correlated with HDL (r = -0.544, P = 0.010, 95%CI: -0.802 to -0.013). T2DM: Type 2 diabetes mellitus; NGM: Normal glucose metabolism; DTI-ALPS: Diffusion tensor image analysis method along the perivascular space; L-DTI-ALPS: Diffusion tensor image analysis method along the perivascular space index of the left cerebral hemisphere in prediabetes and type 2 diabetes mellitus; R-DTI-ALPS: Diffusion tensor image analysis method along the perivascular space index of the right cerebral hemisphere of prediabetes and type 2 diabetes mellitus; Mean-DTI-ALPS: Mean Diffusion tensor image analysis method along the perivascular space index in both cerebral hemispheres; 2hPG: 2-hour postprandial glucose; TC: Total cholesterol; LDL: Low-density lipoprotein; HbA1c: Glycosylated hemoglobin; HDL: High-density lipoprotein.
- Citation: Tian B, Zhao C, Liang JL, Zhang HT, Xu YF, Zheng HL, Zhou J, Gong JN, Lu ST, Zeng ZS. Glymphatic function and its influencing factors in different glucose metabolism states. World J Diabetes 2024; 15(7): 1537-1550
- URL: https://www.wjgnet.com/1948-9358/full/v15/i7/1537.htm
- DOI: https://dx.doi.org/10.4239/wjd.v15.i7.1537


