Copyright
©The Author(s) 2024.
World J Diabetes. Jul 15, 2024; 15(7): 1518-1530
Published online Jul 15, 2024. doi: 10.4239/wjd.v15.i7.1518
Published online Jul 15, 2024. doi: 10.4239/wjd.v15.i7.1518
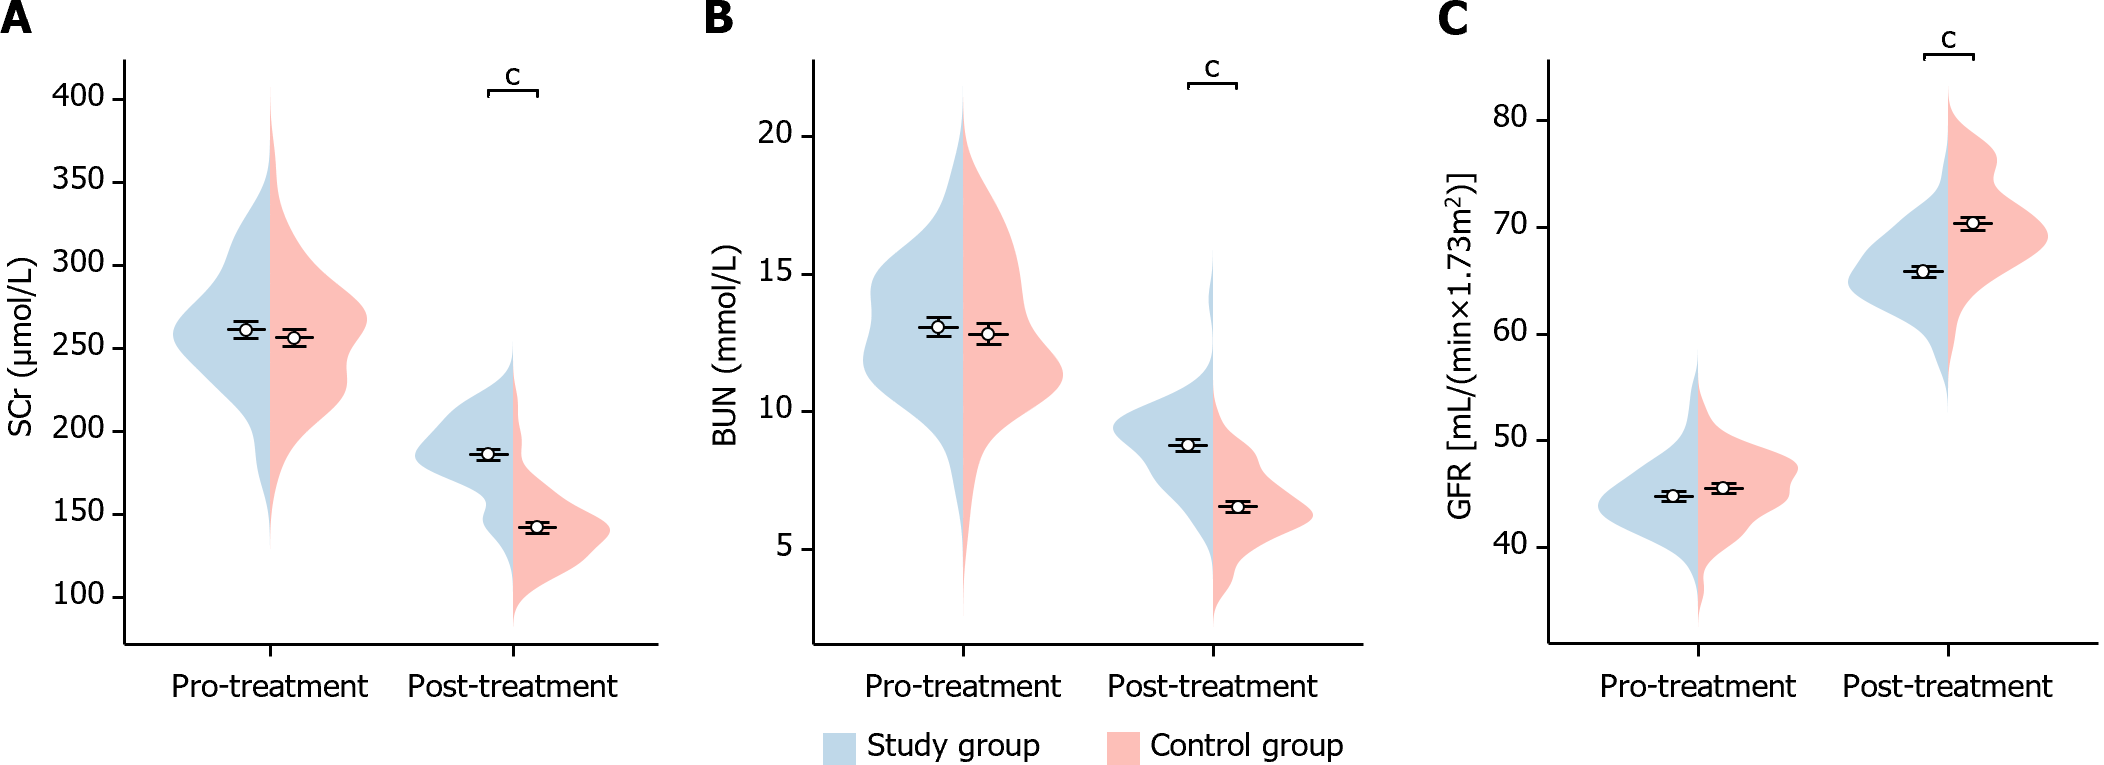
Figure 5 Comparison of changes in renal function before and after treatment in the two groups of patients.
A: The changes in serum creatinine before and after treatment in the two groups; B: The changes in blood urea nitrogen before and after treatment in both groups; C: The changes in glomerular filtration rate before and after treatment in the two groups. cP < 0.001. Scr: Serum creatinine; BUN: Blood urea nitrogen; GFR: Glomerular filtration rate.
- Citation: Yu PL, Yu Y, Li S, Mu BC, Nan MH, Pang M. Dapagliflozin in heart failure and type 2 diabetes: Efficacy, cardiac and renal effects, safety. World J Diabetes 2024; 15(7): 1518-1530
- URL: https://www.wjgnet.com/1948-9358/full/v15/i7/1518.htm
- DOI: https://dx.doi.org/10.4239/wjd.v15.i7.1518


