Copyright
©The Author(s) 2024.
World J Diabetes. Jun 15, 2024; 15(6): 1340-1352
Published online Jun 15, 2024. doi: 10.4239/wjd.v15.i6.1340
Published online Jun 15, 2024. doi: 10.4239/wjd.v15.i6.1340
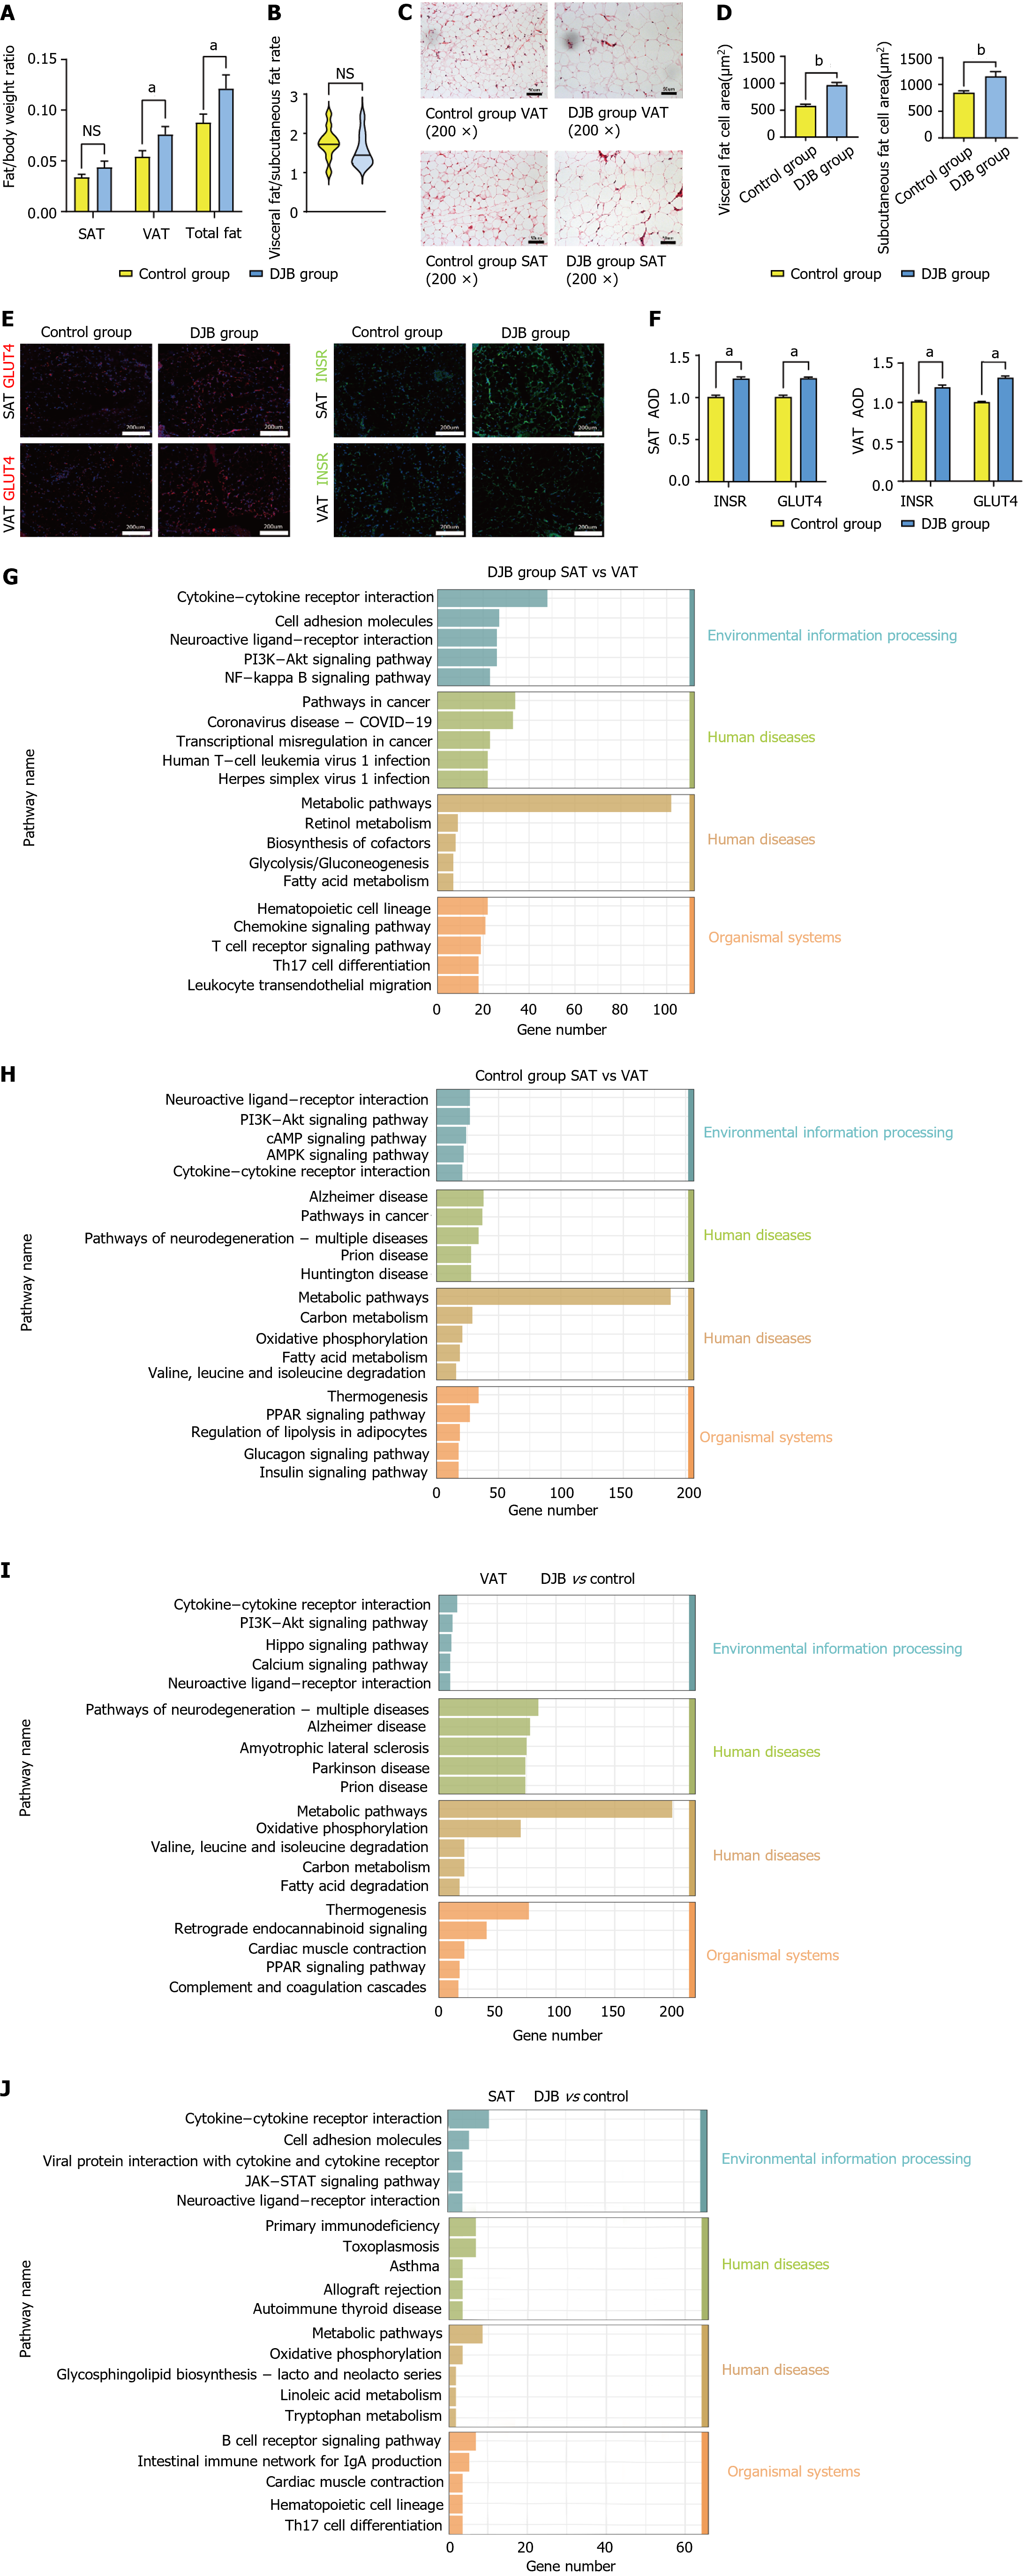
Figure 2 Morphological and transcriptomic evaluation of adipose tissue.
A: Fat/body weight ratio; B: Visceral adipose tissue (VAT)/subcutaneous adipose tissue (SAT) in control and duodenal-jejunal bypass (DJB) group; C: Morphological evaluation of VAT and SAT in control and DJB group; D: Adipocyte area of VAT and SAT; E: Immunofluorescent staining of GLUT4 and INSR; F: Average optical density of the Immunofluorescent staining; G and H: KEGG enrichment analysis between SAT and VAT in DJB group (G) and control group (H); I and J: KEGG enrichment analysis between DJB and control group in VAT (I) and SAT (J). Control vs DJB, aP < 0.05, bP < 0.001 or ns = not significant. DJB: Duodenal-jejunal bypass; SAT: Subcutaneous adipose tissue; VAT: Visceral adipose tissue; AOD: Average optical density.
- Citation: Liu ZT, Yang GW, Zhao X, Dong SH, Jiao Y, Ge Z, Yu A, Zhang XQ, Xu XZ, Cheng ZQ, Zhang X, Wang KX. Growth hormone improves insulin resistance in visceral adipose tissue after duodenal-jejunal bypass by regulating adiponectin secretion. World J Diabetes 2024; 15(6): 1340-1352
- URL: https://www.wjgnet.com/1948-9358/full/v15/i6/1340.htm
- DOI: https://dx.doi.org/10.4239/wjd.v15.i6.1340


